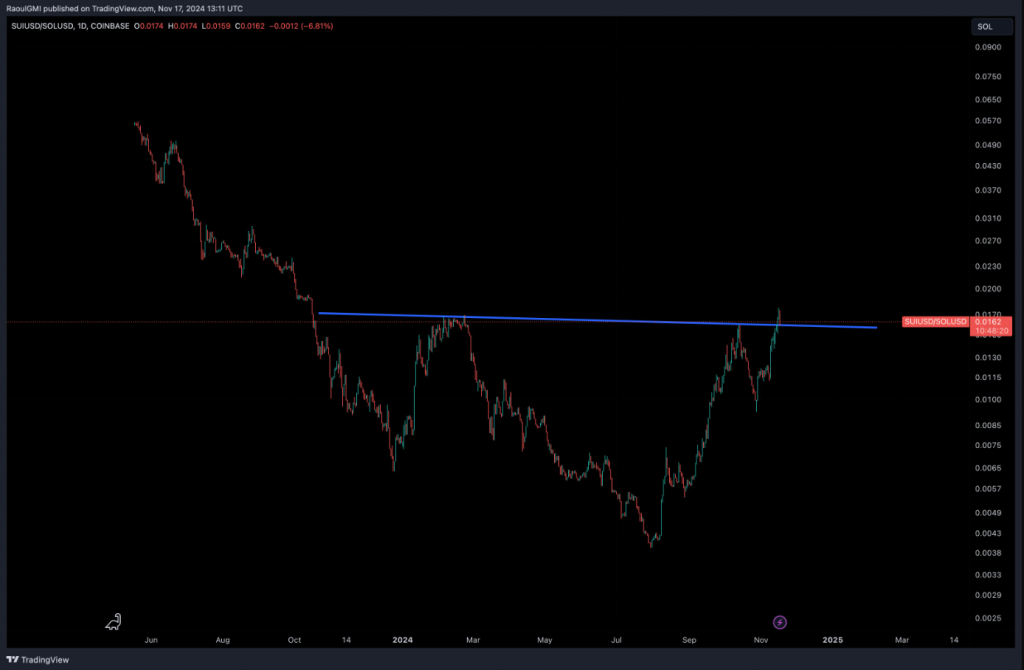
Former Goldman Sachs exec Raoul Pal shows a key crypto chart that signals big changes ahead in the digital asset space. His detailed analysis focuses on crypto market 2024 trends and layer-1 blockchains. Pal shared his comprehensive findings about Solana vs Sui with his million X followers. The technical chart he posted shows a significant pattern that could fundamentally change how the market moves.
Also Read: Solana: VanEck Exec Predicts SOL ETF Launch: Here’s When
Key Chart for Crypto Market Success in 2024: Sui vs Solana Comparison and Insights

SUI’s Potential Breakthrough Against SOL
Pal’s chart shows how SUI stacks up against SOL in the current market environment. SUI trades at $3.71 with notable momentum. SOL sits at $239.74 with strong market presence. SUI ranks 17th by market cap in the broader ecosystem. SOL holds the fourth spot. The Raoul Pal crypto chart points to a critical level where SUI might significantly outperform SOL.
Market Implications and Strategic Outlook
“I keep staring at this chart of SUI/SOL. Probably the key chart in crypto right now to indicate the structure of the market ahead,” Pal posted on X. He plans to strategically move profits into NFT art and Bitcoin later. This matches what leading experts predict for the crypto market in 2024.
Also Read: Will Bitcoin Hit $100K By Thanksgiving?
The Macro Perspective
The Raoul Pal crypto chart shows important insights about how layer-1 chains compete. Pal stated, “I still don’t understand why so many macro guys/girls still mess around in rates, foreign exchange, precious metals, ‘value investing’ commodities and emerging markets when the biggest macro trade of ALL TIME is happening. $3 trillion >>>>>$100 trillion potential in 10 years. Everything else is a waste of capital.”
Technical Analysis Breakdown
The detailed Solana vs Sui chart shows a possible breakout pattern forming in the market. SUI dropped 2% in the last 24 hours, while SOL went up 1%. Pal thinks these technical moves hint at substantial changes in crypto investment strategy.
Also Read: Smart Money Is Watching These 2 Stocks as Trump Wins Presidency
Strategic Investment Considerations
Pal serves on the Sui Foundation board while actively trading for his own profit. This background explains his thorough technical analysis. The Raoul Pal crypto chart comparing SUI and SOL performance suggests layer-1 blockchains might see significant shifts in crypto market 2024 dynamics.


