


RUNE was experiencing a 15% hike over the last 24 hours after tagging its 23rd May swing low of $5.96. A down-channel breakout presented an opportunity to go long in case of a throwback to $6.4. However, observers must be cautious of a close below the $5.80 as this would likely see RUNE form a new low at the lower trendline.
RUNE 4-hour time frame
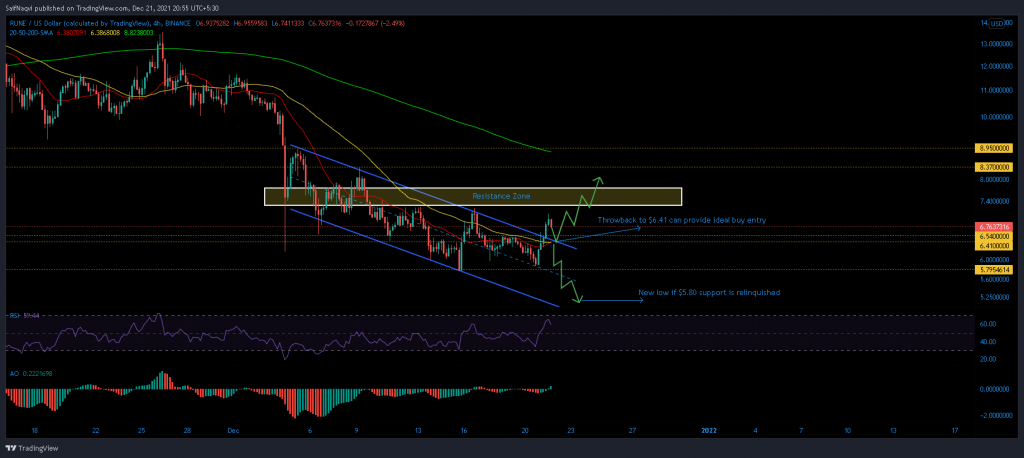
RUNE finally broke north of its down-channel after testing the upper boundary thrice in December. However, consistent buy volumes would be needed in order to flip a key resistance zone between $7.78-$7.29. From there, swing highs at $8.37 and $8.95 can be overcome, setting up a trend switch above the 200-SMA (green).
Traders should be on the lookout for a throwback to $6.54-$6.41- a region backed by the 20 (red) and 50 (yellow) SMA’s. However, caution should be taken if RUNE slips below the mid-line and $5.80 support. A new low can then be expected around $5.5 at the lower trendline.
Indicators
RUNE’s 4-hour indicators noted a massive spike after showing lackluster movement. The RSI traded below 50 for the most part of December thus far. It has experienced sudden jumps only on two occasions and its current reading must be taken with a pinch of salt. Similarly, the Awesome Oscillator registered a move above the half-line after forming a bullish top. However, its trajectory over the coming sessions would add more clarity in terms of a consistent price hike.
Conclusion
RUNE’s near-term price trajectory depends on how the price would interact between $6.54-$6.41. If the presence of the 20 and 50 SMA’s initiate new longs, a continued northbound push can be expected moving forward. On the flip side, traders must be cautious of a new low if RUNE slips below $5.80-support.