


Buy signals on the RSI and MACD combined with a bullish 200 period EMA suggested that SafeMoon’s 24-hour decline was finally coming to a halt. However, the short-mid-term EMA’s and the 38.2% Fibonacci level did pose some near-term threats. At the time of writing, SafeMoon traded at $0.001750, down by 9.9% over the last 24 hours.
SafeMoon hourly time frame
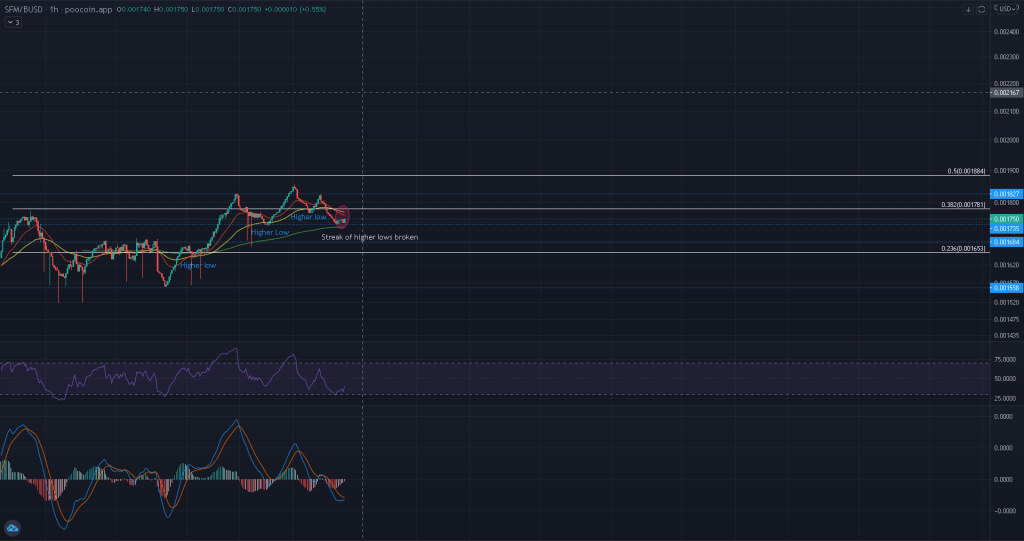
The last five days of trade have been quite eventful for SFM. The price formed three higher lows and three higher highs and snapped a 13-day high at $0.001855. However, this streak of higher lows was disrupted 48 hours ago as the price retested $0.001735 support after a 5% pullback. Normally, this development would indicate a trend shift as bulls were losing momentum. However, it was too early to make such calls. The price still traded above its hourly 200 period EMA which was yet to be toppled.
Should buyers respect this MA and force a close above the 38.2% Fibonacci level, SFM can begin to target higher levels once again. Moving past immediate targets at $0.001827 and $0.001855 would help cement its price above the 50% Fibonacci level. The 50% Fibonacci often dictates mid-long trends as is considered a crucial price zone.
On the flip side, short-sellers would enter the fray in case of a close below the 200 EMA. In such a case, the 23.6% Fibonacci and $0.001735 support would be SFM best bet at an immediate recovery.
Indicators
SFM indicators were also beginning to recover after a rough 72 hour period. The hourly RSI traded at the oversold zone and warranted stabilization. Another bull run could even follow if the RSI recovers safely above 55-60. Meanwhile, selling pressure was easing as per the MACD’s histogram. A buy signal would even come to light should a bullish crossover take place over coming sessions.
Conclusion
Although SafeMoon did break its streak of higher lows, recoveries along the MACD and RSI were a positive sign. Those with a higher risk apatite can long SafeMoon once the MACD fully completes a bullish crossover. Take profits can be set at the 50% Fibonacci level. On the other hand, safer bets can be made once SFM closes above its 20 (red) and 50 (yellow) period EMA’s.