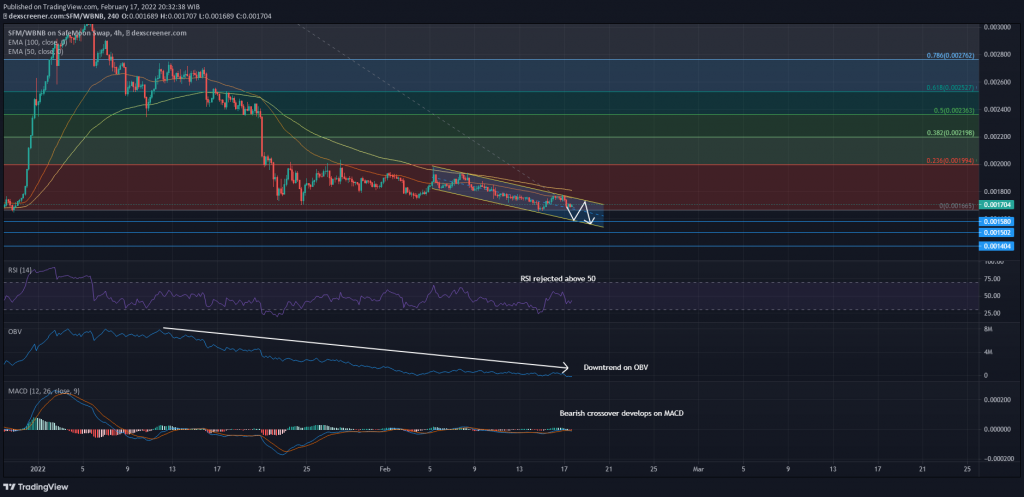
SafeMoon V2 has consolidated for nearly a month now, with bears carrying a slight preference due to the creation of lower lows. The indicators continued to favor the bearish side, with the OBV picturing a violent downtrend since the second week of January. New lows were expected during the week unless the 100-period EMA is overcome. At the time of writing, SFM traded at $0.001704, up by 4.7% over the last 24 hours.
SafeMoon V2 4-hour Time Frame

SafeMoon’s On Balance Volume sits at its lowest ever since its migration from V1. The index is a measure of buy volume against sell volume. The graph slips lower once sell volume outpaces buy volumes and vice versa when buy orders outweigh sell pressure. With an immediate rally out of sight, SFM’s current down-channel was expected to shift lower, especially after bulls were denied a breakout above the 50-period EMA.
Should bears maintain the upper hand, SFM would form a new lower low at $0.001580-support. In case of a breakdown, the regions between $0.001485-$0.001404 can be called upon. For the moment, there were not many critical defenses to rely on in terms of a price rally. Investors would likely have to wait for a risk-on broader market to begin pouring investments back into SafeMoon.
Meanwhile, the bleak outlook was backed by an under-50 RSI and a bearish crossover on the MACD. A closer inspection showed that the RSI was rejected above 50, suggesting that bears were not ready to give up control. Furthermore, the MACD has traded below its half-line for over 10 days now, which would continue to attract attention from short traders.
On the flip side, a move above the 200- period EMA (yellow) could generate additional momentum for an upwards swing, however, bulls would have to get past the 23.6% Fibonacci level for an extended recovery.
Conclusion
Shorting SafeMoon was a safer bet than placing any new longs considering the above-mentioned factors. Since an upwards breakout was rejected, bears would likely resume control until a new low is formed around $0.001580.


