


SafeMoon V2’s price has taken a downwards path for the majority of March, with its monthly ROI slipping to a negative 11.4%. The chart shows that SFM is still open to shorting opportunities due to a bearish technical pattern, weak metrics, and an absence of hype trading.
SafeMoon V2 Price
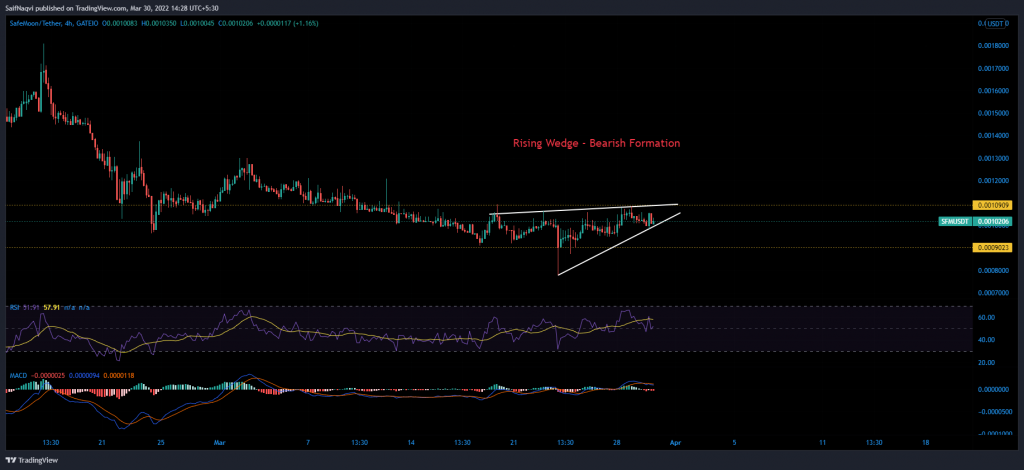
SafeMoon’s woes were evident through just a quick look at its 4-hour chart. Kickstarting the month at a high of $0.00130, SFM failed to maintain its price, slipping below $0.00104 and $0.00109 support levels over the following weeks.
While the last 10 days have shown a semblance of an uptrend, an untimely rising wedge was spotted in the lesser time frame. Generally, rising wedges dictate higher price action but are extremely vulnerable to a breakdown. In most cases, indicators can help determine whether or not an asset will bow down to the said bearish formation.
In that respect, two of the most important indicators flashed warning signs and the situation was not looking favorable for SFM. The 4-hour RSI was struggling to find a footing at neutral 50, while the MACD was grappling with a bearish crossover.
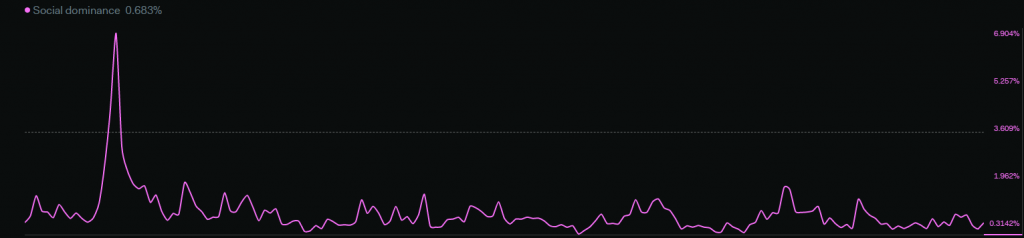
Additionally, the SafeMoon army has been rather quiet lately and hype trading was out of the question for now. As per LunarCrush, SafeMoon’s weekly social dominance was down by 31%, showing a drastic decline in social media mentions and references.
Price Strategy
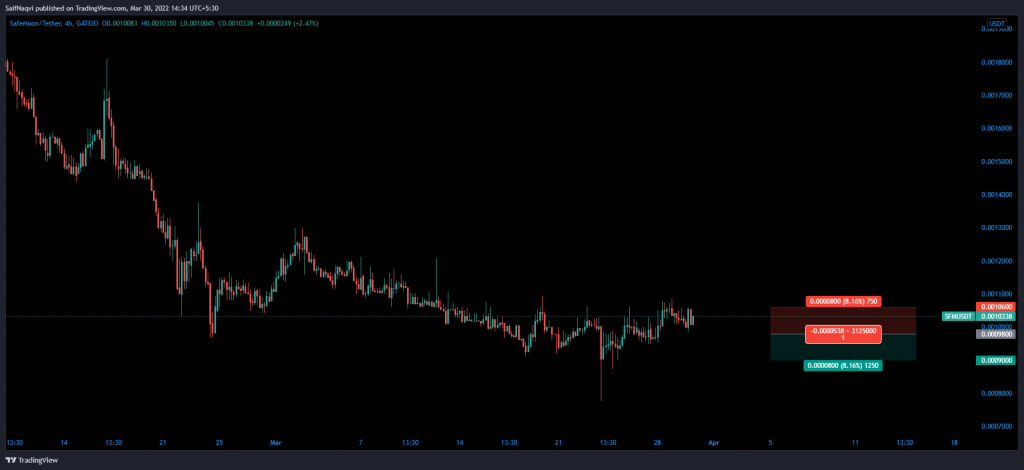
With a host of factors pointing towards weak price action over the coming days, a logical trade would be to short SFM’s wedge. Traders can make short calls at $0.000980 and take-profit at $0.000900. Stop-loss can be set at $0.00106. The trade setup carries a risk/reward ratio of 1.