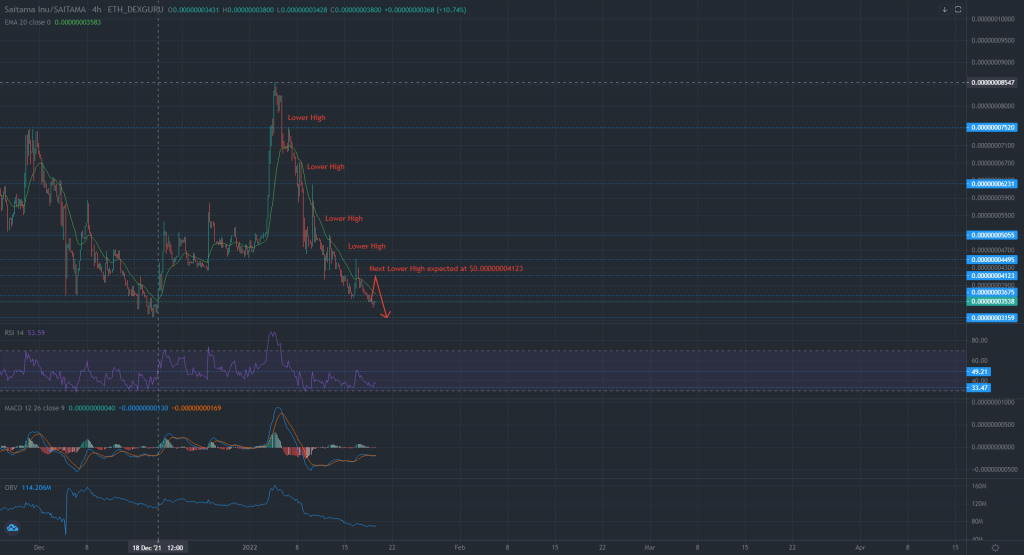
Saitama Inu eyes a brief run-up and a new lower high after tagging an important zone between $0.00000003675-$0.00000003159. An optimistic outlook was supported by MACD’s bullish divergence. However, investors must be alert of broader market weaknesses as losses in SAITAMA’s market could spiral rather quickly if Bitcoin slips below $40K. At the time of writing, SAITAMA traded at $0.00000003538, down by 0.2% over the last 24 hours.
Saitama Inu 4-hour time frame


Saitama Inu has formed four distinct lower highs since 5 January as a larger downtrend continues to see brief periods of relief. Its price was currently parked within a support zone of $0.00000003675-$0.00000003159 and going forward, a new lower high was expected around $0.00000004123. A favorable scenario was expected after a series of higher lows along the MACD formed a bullish divergence with respect to SAITAMA’s price action.
Moreover, the 4-hour RSI was expected to recover after tagging the lower boundary of a horizontal channel. Since the indicators traded below their half-lines, traders should play safe and wait for SAITAMA to confirm a bullish outlook by closing above its 20-EMA (blue).
Conversely, a 4-hour candle below $0.00000003159 would allow sellers to take advantage of the chinks in SAITAMA’s armor. The lack of any immediate support levels would put SAITAMA at risk of a 30% sell-off, with its next logical support available only at $0.00000002265.
Meanwhile, a prolonged rally would be unlikely until the On Balance Volume manages to reset its decline over the coming weeks.
Conclusion
Those setting up buy orders between $0.00000003675-$0.00000003159 should maintain a tight take-profit amidst a larger downtrend. Bullish traders can set up take-profits around 15 December’s swing high of $0.00000004123 once SAITAMA closes above its 20-EMA (blue). On the other hand, a close below $0.00000003159 should be followed by short positions.


