


Recent corrections in the crypto market have been unkind to meme projects. Since Bitcoin’s drop from $40K last week, losses have piled up for Saitama as short traders ran amuck. The daily indicators show that downside risks were still intact and a close below immediate support could expose the market to another 80% decline.
Satiama Daily Chart
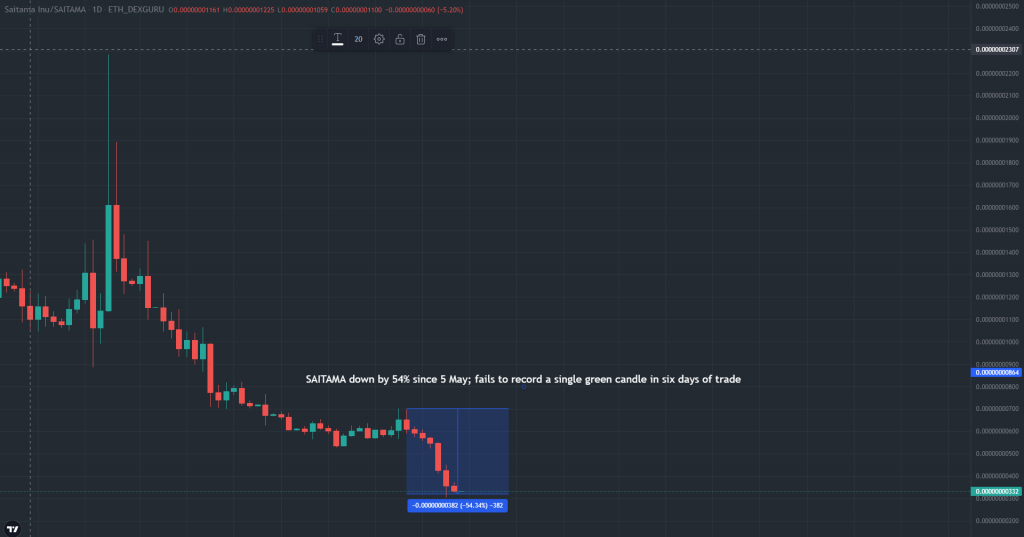
Saitama Inu’s daily chart was quickly becoming a pit stop for short traders. Recent corrections in the crypto market were tantalizingly brutal for SAITAMA, which logged over a 50% decline between 4-9 May. The dearth of buyers was felt on 10 May, when the broader market recovered slightly but Saitama failed to record a single green candle.
During such a downtrend, it’s necessary to look beyond price and gauge how the ecosystem is faring. Arguably, the biggest update on the ecosystem has been linked to a native token launched in March, Saita Realty.
Now, Saitama’s price spiked by 44% during Saita Realty’s launch in March, suggesting that investors were bullish about the ecosystem’s new native token. However, since then, Saita Realty has not proven to be a long-term driver for growth just yet. This may be in part due to several liquidity issues post-launch and several accounts of failed transactions from users.
Saitama Price Prediction
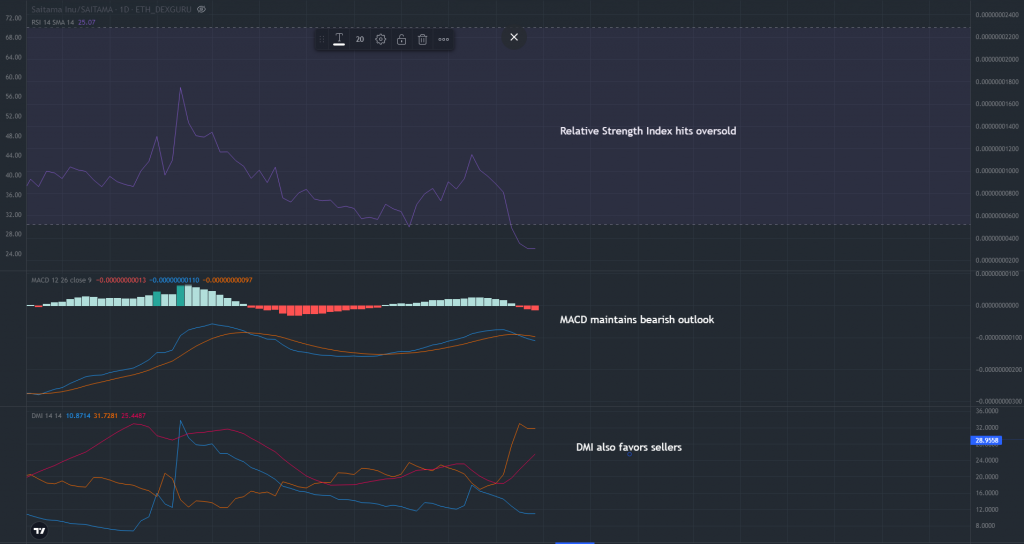
As it has been recently, the short-mid term outlook for Saitama was still looking bearish. The daily MACD flashed a sell signal yesterday and downside risks were intact. The Directional Movement Index also presented a similar outlook as its -DI line (orange) held above the +DI line(blue) – an unwanted development for bullish traders.
The only positive came from an oversold RSI which does tend to trigger buy orders. However, the 24-hour trading volumes of just $5.1 Million suggested that traders were keeping their distance from Saitama’s press-time level.
These developments leave Saitama in a tough spot on the daily chart. Should a daily candle close below $0.0000000260, SAITAMA would be exposed to another 80% since the next logical support was available only at $0.0000000080.
To negate this outlook, it was important for SAITAMA to shift back above its 9-period EMA (not shown) at $0.0000000430 – something which SAITAMA has failed to do in nearly two months.