


While Shiba Inu’s price action has remained disgruntled over the past two months, external developments have allowed the alt to remain relevant in the market. Listings on Bitstamp and Spain’s Bit2Me indicate that SHIB continues to be in demand despite a dull broader market. In fact, SHIB’s near-term price action has now started to look favorable once again. A 9% jump over the last 24 hours has put Shiba Inu on the precipice of a down-channel breakout. A move above the 50-SMA (yellow) could open the doors for an additional 15% hike to 12 December’s swing high of $0.00003790. With key indicators showing some signs of life, SHIB could finally shake off a relentless downtrend that has lasted since late October.
Shiba Inu 4-hour Time Frame
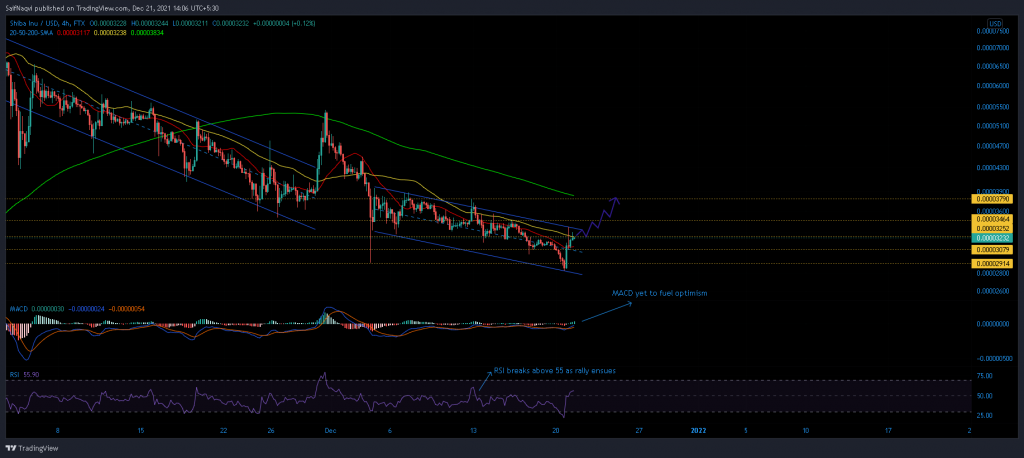
Since snapping an ATH in late October, Shiba Inu has been pressured by consistent outflows observed in the broader market. As a result, its value has steadily declined within multiple down-channels, with breakouts in either direction having little impact on SHIB’s overall trajectory.
However, SHIB was eyeing another breakout after bouncing back from the lower trendline of its down-channel. A decisive close above the 50-SMA (yellow) and $0.00003252 resistance could put SHIB on course to 12 December’s swing high of 0.00003790. The 200-SMA (green) would keep an extended price hike in check. Interestingly, a similar breakout was observed on 29 November after SHIB toppled its 50-SMA (yellow) to bullish. A further 33% ensued which was finally countered around the 200-SMA (green).
Indicators
SHIB’s indicators also made key developments. For instance, the Relative Strength Index, which is used to gauge strength or weakness in the market, climbed above 50 for the first time in 10 days. The last time this index broke above its mid-line, a 15% price hike was observed. Moreover, SHIB could even extend its value beyond the 200-SMA (green) should its RSI consistently trade above 55-60 over the coming days. Now the MACD, which shows the relationship between the 12 period and 26 period EMA, also registered a bullish crossover. However, some amount of skepticism would still persist till the index rises above its equilibrium mark. Should SHIB fail to overturn its 50-SMA (yellow), near-term support levels of $0.00003079 and $0.00003121 could cut losses and fuel another upwards run.
Conclusion
Shiba Inu needed to close above its 50-SMA (yellow) and $0.00003252 resistance to pave for a possible 15% hike. Once a supply area at $0.00003464 is successfully cleared, SHIB would likely tag its 12 December swing high of $0.00003790, which was backed by the 200-SMA (green). If SHIB is rejected at its immediate resistance, support levels of $0.00003079 and $0.00003121 would take center stage.