


Shiba Inu’s relentless downtrend has continued for 76 days now, with the last rally observed in October 2021. Since then, upwards momentum has not matured beyond quick pumps and dumps. Fortunately for SHIB, the daily 200-SMA (green) could be the answer to many of its problems. A new lower high followed by a pullback would activate the long-term moving average and generate fresh buy orders in the market. At the time of writing, SHIB traded at $0.00002882, up by 7% over the last 24 hours.
Shiba Inu Daily Time Frame
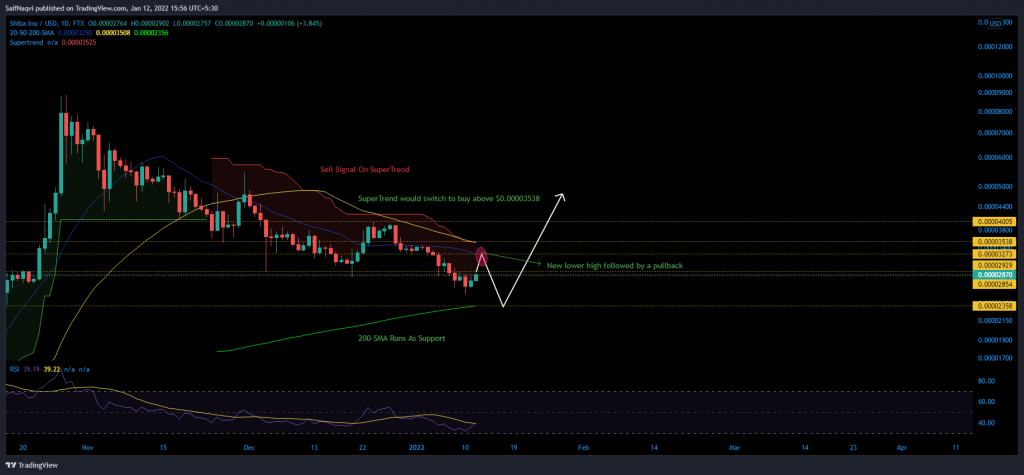
There were hardly any bullish takeaways on Shiba Inu’s daily chart, save for a 200-SMA (green) which ran as support. Brief run-ups have not extended beyond some important resistance caps and a stagnant broader market has not helped either. Lower highs continue to be a feature for SHIB and its current run-up would most likely be halted between $0.00002936 and $0.00003291.
However, the next pullback would shine a light on the daily 200-SMA (green) and $0.00002428 support. The resulting rally would arguably be SHIB’s most important one in the first quarter of 2022. SHIB would have to complete a full 50% surge above $0.00003538 to flip its streak of lower highs. If the rally fails to extend beyond the 20-SMA (red), sellers would likely resume their grip on the market. A damaging sell-off would even follow once the 200-SMA (green) is breached by sellers.
Shiba Inu Weekly Chart
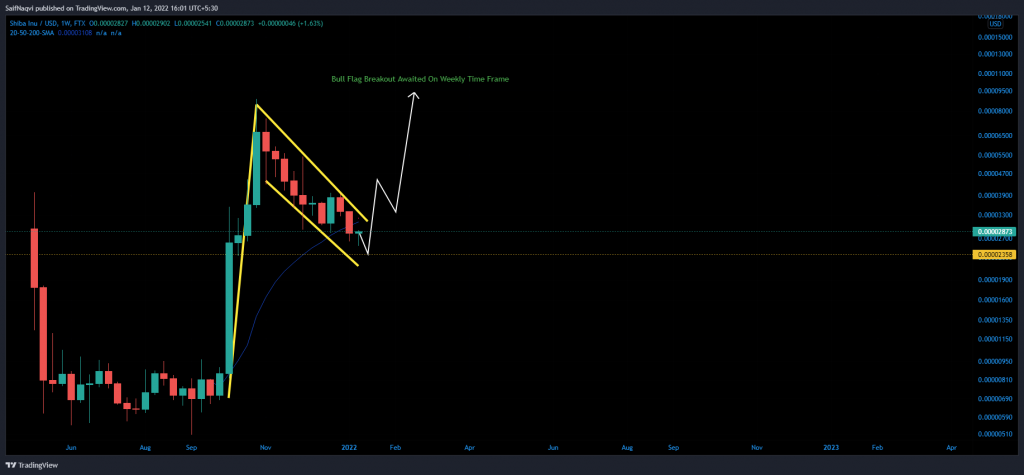
Interestingly, SHIB was on the hunt for an important support line for a bull flag breakout on the weekly chart. This reinforced the importance of SHIB’s daily 200-SMA. However, the setup would be invalidated if the downtrend extends into another week, or if the daily 200-SMA (green) flips bearish.
Daily Indicators
The SuperTrend indicator presented a sell signal on SHIB, with a stop loss placed at $0.00003538 as well. A majority of sell pressure would be flushed out if SHIB can close above this crucial level. However, as highlighted earlier, a 50% surge would not be easy without a broader market rally.
Meanwhile, traders would continue to bet against SHIB until the RSI climbs above 45-50. Till then, any upside would be limited.
Conclusion
A lot rode on Shiba Inu’s daily 200-SMA (green). In fact, it was responsible for overcoming a downtrend that has persisted since October 2021. However, SHIB must prove itself above $0.00003538 in the coming weeks to bring back confidence among its investors.