


Shiba Inu rewarded investors with a weekend rally but the market is now indicative of a cooling phase going forward. The hourly metrics and a slash in trading volumes suggest a consolidation period up ahead. At the time of writing, Shiba Inu traded at $0.00002325, up by a marginal 0.06% over the last 24 hours.
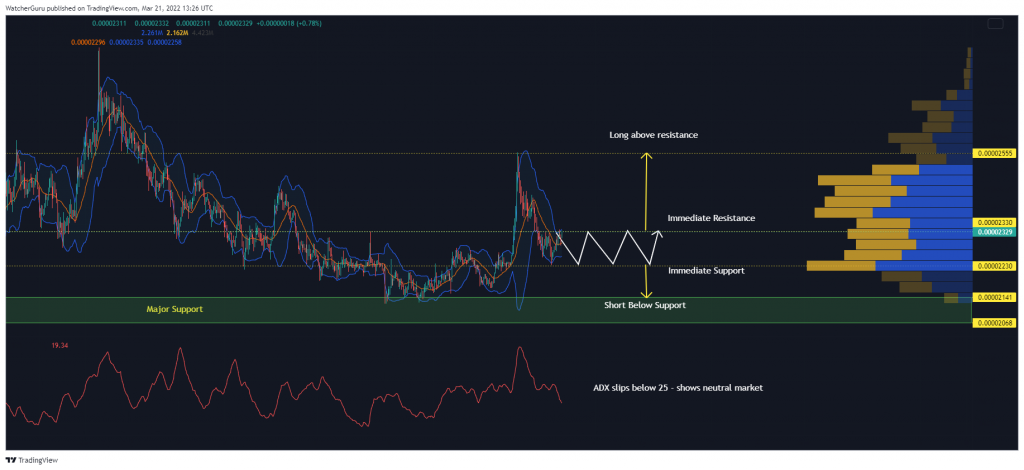
Shiba Inu Hourly Chart
Bulls and bears have traded blows in the Shiba Inu market of-late. Taking inspiration from a Bitcoin rally last week, Shiba Inu dominated proceedings through a 15% hike on 19 March. The resulting correction was felt immediately as profit-taking triggered an 11% correction.
Following the wild price swing, market participants were taking a breather. This was outlined by a few developments on the hourly chart. Firstly, a contracting Bollinger Bands suggested that a period of low volatility was ready to take over. Secondly, the hourly ADX slipped below 25, indicating that the market was becoming less directional. Finally, the 24-trading volumes across exchanges slashed by nearly 60% as per CoinMarketCap.
The Visible Range profile further illustrated that Shiba Inu was trading in a region of high liquidity, between $0.00002330-$0.00002241. Buyers and sellers are known to interact more in such areas, which causes the price to travel at a relatively slower pace.
Whale Purchases Dry Up?
Unfortunately, top Ethereum whales had not offered a helping hand to Shiba Inu during the present correction. Shiba Inu was not part of the most purchased tokens, most used smart contracts, or among the widely held tokens over the last 24 hours.
Price Strategy
Trading a rangebound market is quite tricky and in most cases – ill advised. However, should one want to remain active in the market, buying at support and selling at resistance is a safe call to make. More specifically, traders can place sell orders at $0.00002330-resistance and buy orders at $0.00002330 support.
In the meantime, others can wait for further developments before making bets. A breakout above the overhead resistance can be followed by safer long calls whereas a breakdown below the immediate support can be responded by short trades. However, the current market dynamics point to timid movement this week.