


Solana has formed a cup and handle pattern on the lesser time frame and projects a brief run-up between the 50% and 61.8% Fibonacci levels. However, expect any upside to be limited until a bleak Bitcoin continues to plague alts. At the time of writing, SOL traded at $148, down by a marginal 0.4% over the last 24 hours.
Solana 4-hour time frame
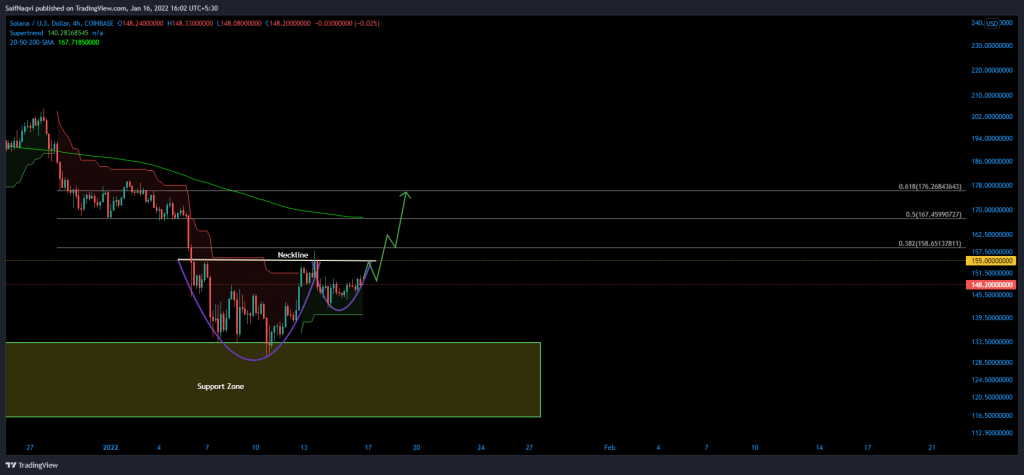
Solana looks to grant its investors a quick profit after forming a cup and handle pattern on the 4-hour chart. A close above the neckline at $155 could activate an 8%-14% run-up to the Golden Fibonacci Retracement Zone (50% – 61.8% Fib levels), which harbored the 4-hour 200-SMA (green) and daily 50-SMA (not shown).
However, keep in mind that SOL’s move above $155 would have to be backed by strong buy volumes to fully realize its target. A weak breakout might be rejected at the 38.2% Fibonacci level, luring investors into a bull trap.
Meanwhile, a close below $140 would create a lower low and invalidate SOL’s ‘handle’, thereby negating a bullish prediction. The next logical support would lay within a demand zone between $133-$116.
Indicators
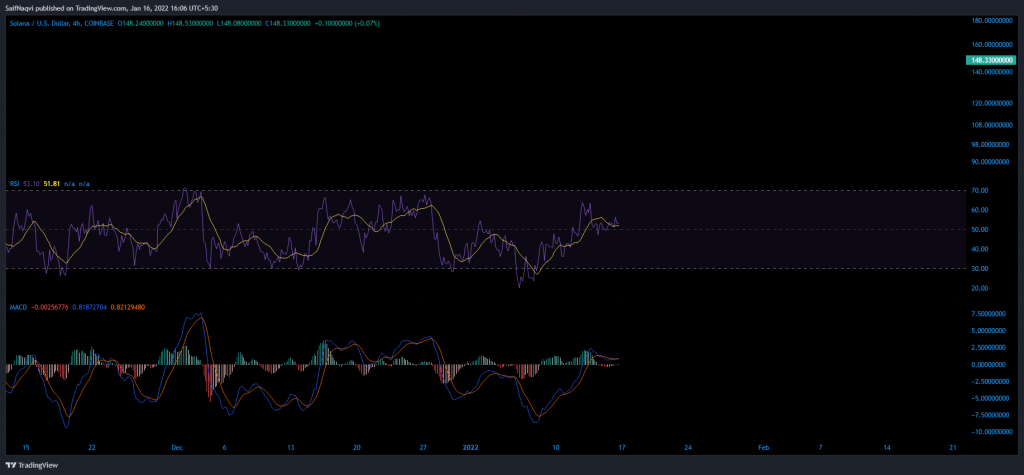
For the moment, a weak broader market trend took precedence overshadowed SOL’s bullish setup and investors were yet to jump on board. The 4-hour RSI and MACD held slightly above equilibrium levels, reflecting the wider consolidation among large-mid cap alts.
Having said that, the SuperTrend indicator (highlighted on the 4-hour chart) did present an early buy signal and placed a stop-loss below $140.
Conclusion
Those who will want to trade SOL’s cup and handle can go long once the price closes above the neckline at $155. Take-profit can be set between the 50% and 61.8% Fibonacci levels and stop-losses below $140. However, caution must be maintained if the breakout is on weak buy volumes or if SOL is reluctant to move above its 38.2% Fibonacci level.