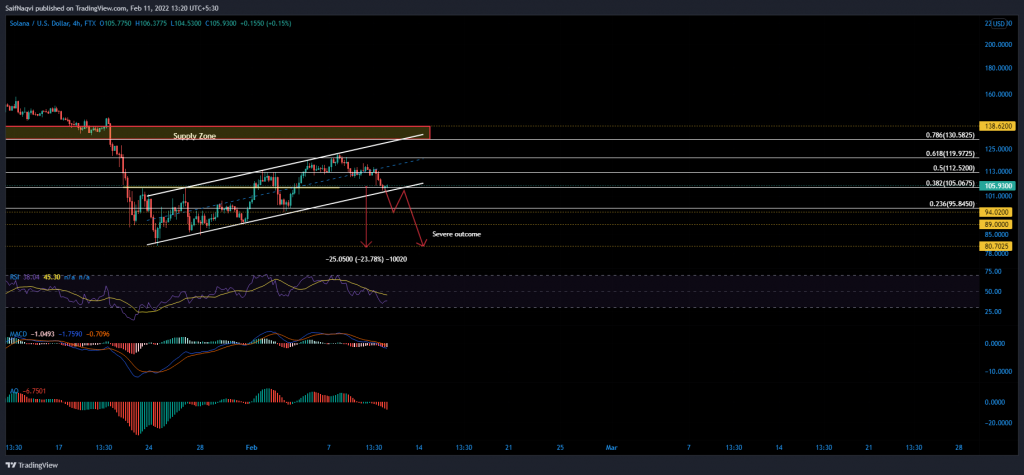
A 14% drawdown over the last three days has put Solana in a critical position on the chart. An up-channel breakdown would sound alarm bells in the market and paint heavy losses over the weekend. At the time of writing, SOL traded at $105.6, down by 6.5% over the last 24 hours.
Solana 4-hour Time Frame


Solana sits on the precipice of a major decline should its price weaken below an active up-channel. The lower trendline of the pattern coincided with the 38.2% Fibonacci area and daily 20-SMA (not shown), making it significant for bulls to hold on to. A close below $102 would bust SOL’s market-wide open as sellers push through to previous swing lows at $94, $89, and even $80 in a severely bearish outlook. The move to the lowest near-term support marked a further 23% decline from SOL’s press time level.
For the moment, the 4-hour metrics were not very supportive of a bullish rebound. The 4-hour MACD was amidst a downtrend and even slipped below its half-line over the past few sessions. A sub-par MACD usually attracts more sell-side momentum.
Furthermore, the Awesome Oscillator registered seven consecutive red bars below equilibrium, marking an increased bearish force as SOL tests the lower trendline. The present reading was last observed during January’s flash crash where SOL recorded a 44% sell-off.
The only saving grace came from a near-oversold RSI. An RSI dip to 30 can sometimes lead to new longs as the price is regarded as “cheap”. A successful rebound from the lower trendline can lead up to a new higher high around $128, although the same was a low probable outcome.
Conclusion
Solana could be under immense pressure over the weekend in case its price slips below $102. Hence, those longing SOL at its current price level must take caution, especially if Bitcoin’s correction extends into Saturday.


