


Solana vs Litecoin trends are showing quite different patterns at the moment, with Solana displaying some rather bearish signals while Litecoin seems to be, well, aiming for those higher resistance levels amid all this ongoing crypto market volatility that we’ve been seeing lately.
Also Read: China Evaluates US Talks as 125% Tariff Clock Ticks Down
Crypto Price Predictions Amid Volatility: Solana & Litecoin Moves

Solana Shows Bearish Signals Despite Recent Gains
Solana’s futures and also spot markets are, right now, displaying some rather bearish indicators that might actually trigger a 5% downward price movement in the coming days. According to the data from Coinglass, SOL’s funding rates have sort of turned negative, and this is typically signaling an increase in short positions.
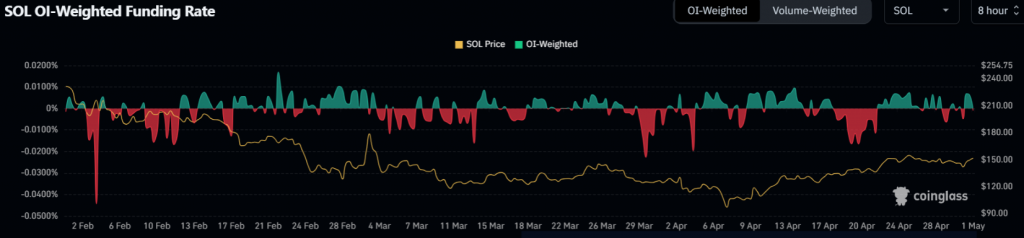
This pattern has been, you know, observed repeatedly in the Solana vs Litecoin market comparison over recent weeks. Also, the spot market data kind of reinforces this Solana price prediction, with exchange inflows rising over the past 24 hours or so.
Technical Outlook Points to Key Levels for SOL
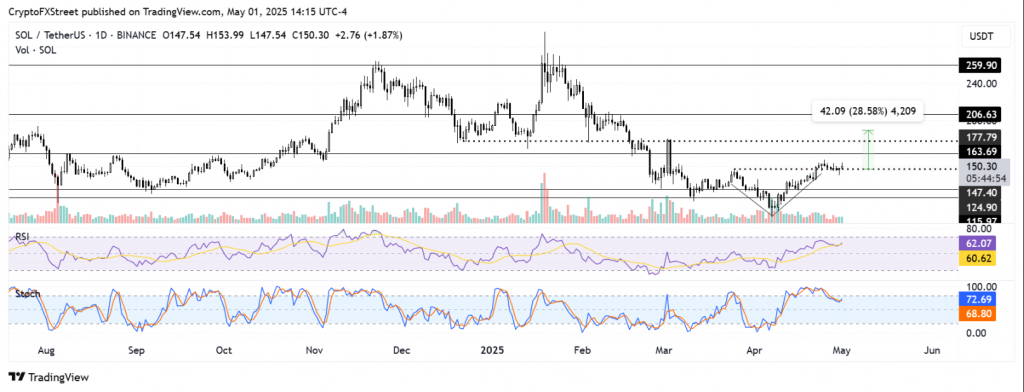
From a technical perspective, and this is interesting, Solana has been consolidating near that $150 level after its V-shaped reversal pattern between March and April. The critical support actually sits at around $147, with the next major support somewhere around $125.
Also Read: Bitcoin (BTC) Price Prediction For May 2025
Litecoin Approaches Critical Resistance
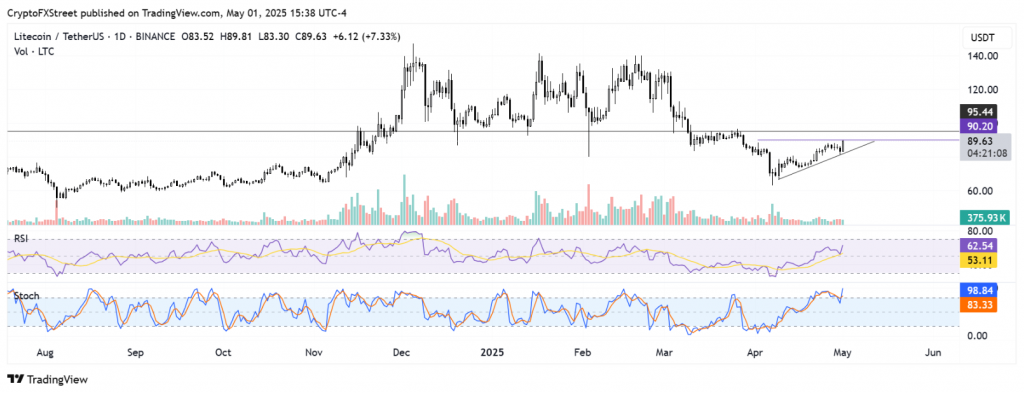
In contrast to Solana’s outlook in the Solana vs Litecoin technical analysis, LTC has, at the time of writing, formed what appears to be a bullish ascending triangle pattern since April 9. LTC is currently testing that crucial $90 level, with an even more significant $95 resistance beyond that.
A crypto market analyst had this to say:
“Litecoin has been trading within an ascending triangle pattern, rising gradually since April 9. The $95 level stands as a major resistance, considering LTC saw a rejection near it several times in March.”
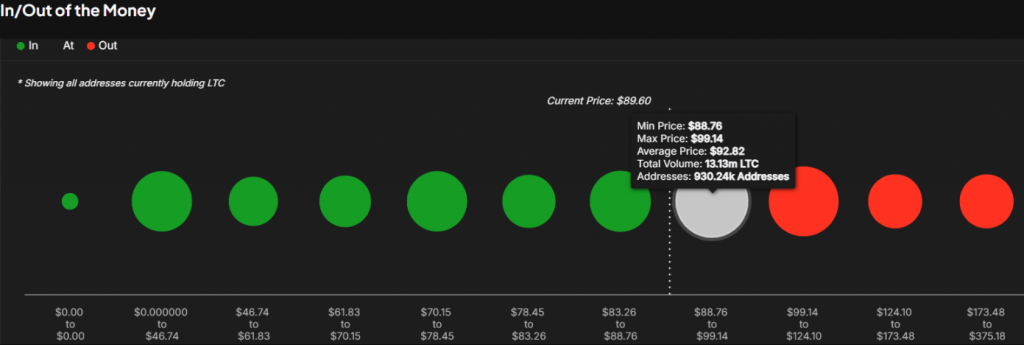
The data from IntoTheBlock reveals that the Litecoin price prediction really hinges on that $88-$99 range:
“The Global In/Out of the Money metric shows that $95 falls within Litecoin’s largest historical demand range — $88 to $99 — where investors purchased over 13.13 million LTC.”
Also Read: AI Predicts PEPE & Shiba Inu Price For May 5, 2025
This Solana vs Litecoin comparison basically reveals that while the Solana price prediction is signaling a potential drop due to those negative funding rates and such, the Litecoin price prediction is actually suggesting possible gains if key resistance levels are conquered amid all this crypto market volatility we’re experiencing.