


While Stellar Lumens has recovered ground since the wider market sell-off on 3 December, bullish momentum has been slow. Weekly gains of 10% were moderate in hindsight but sluggish when compared to the likes of LUNA, SHIB and even XRP. However, the formation of a cup-and-handle pattern had the potential to fast-track XLM’s price progression.
An upwards breakout can trigger a 30% run up to 3 December’s swing high of $0.3649, from where higher levels can be targeted. At the time of writing, XLM traded at $0.290, up by 2.3% over the last 24 hours.
Stellar Lumens 4-hour time frame
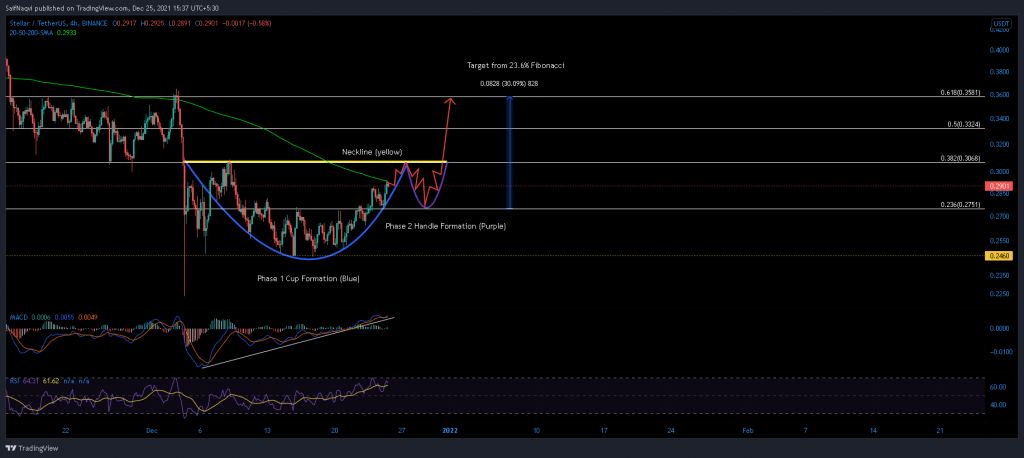
A curved trendline charted Stellar Lumens’ trajectory since 8 December and gave rise to a cup and handle pattern. This bullish pattern is usually divided into two phases. The first phase shows a ‘cup’ formation as the price gradually recovers ground post a steady decline. The second phase or ‘handle’ is observed after the ‘neckline’ (resistance) triggers a minor retracement. A breakout occurs when the price finally closes above the neckline once the handle is formed.
Looking at the charts, XLM was yet to form its handle. In fact, the price first had to flip its 200-SMA (green) before approaching its neckline at the 38.2% Fibonacci level. When bulls advance to $0.3068, a retracement can be expected back towards the 23.6% Fibonacci level. This movement would complete XLM’s ‘handle’. Once a breakout is observed, a 20% upwards run to $0.3649 awaited XLM provided bulls overcome pressure at the 50% Fibonacci level. On the other hand, a close below the $0.257 support would invalidate this bullish setup.
Indicators
XLM’s indicators presented underpinned breakout predictions and suggested that the price was ready to enter the second phase. The 4-hour RSI held above 60 and invited longs while the MACD’s uptrend indicated consistent buying activity over the last 20 days. However, keep in mind that XLM’s handle was yet to form and the 38.2% Fibonacci level was expected to trigger a 10% retracement.
Conclusion
XLM was primed for an immediate 6% rise once it closes above its 200-SMA (green). After tagging the 38.2% Fibonacci level, a minor sell-off would see XLM complete its ‘handle’ at the 23.6% Fibonacci level. Ideal buy entries can be placed at this price point ($0.275). If timed correctly, an upwards breakout would allow investors to bag a 30% profit from their investments.