


In VeChain Technical Analysis, we focus on price patterns, past statistics, and RSI to predict the future movement of Vechain’straders can use the currency.
VeChain network is a blockchain-related supply chain platform. Started in 2015 and launched its first smart token in June 2016. The VeChain token is called VETs exchange tokens.
VeChain (VET) Current Market Status
VET’s price has grown by 13.3% in the last 24 hours and currently trades at $0.149, with a trading volume close to $1,474,535 788. This shows how popular this currency is.
Moreover, the number of VET in circulation is 66,760,741, and it trades on Binance, FTX, Tokocrypto, Huobi Global, and Upbit.
VeChain (VET) Technical Analysis
VeChain (VET) has been on a tear recently, with the recent development and upgrades pushing it to new heights. The CoinGecko ranks it at 21st position among other tokens. Thus, Vet has a bright future.

Source: TradingView
The Ascending Channel Trend pattern is a set of upward sloping parallel lines that the price travels between. When this action continues to where there are no more valleys, it will eventually reach $0.7.
VeChain (VET) RSI
This chart shows the relative strength index (RSI) of VeChain.
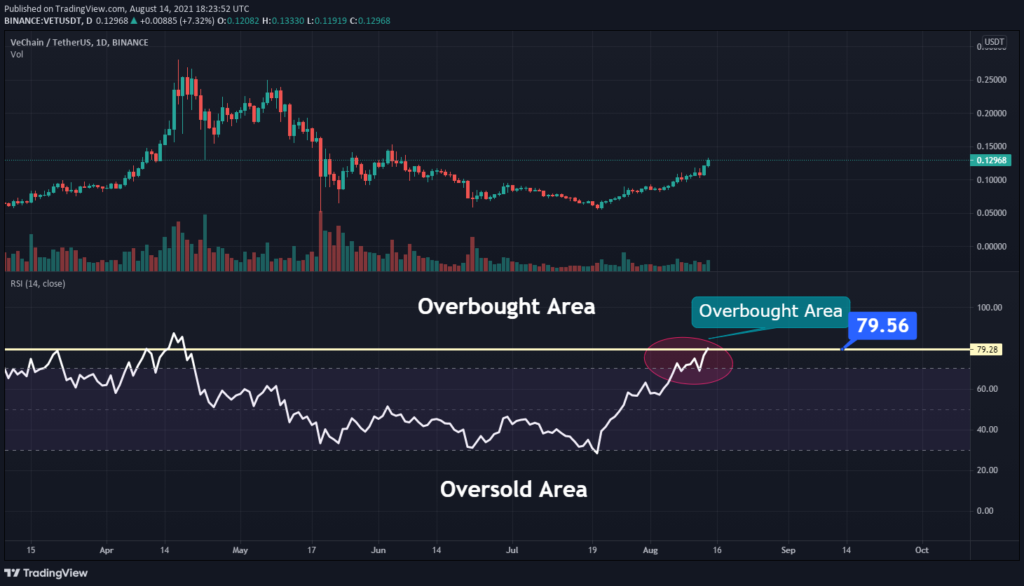
Source: TradingView
The chart shows that RSI or Relative Strength Index is near the upper bound of overbought. This means there has been little movement in VET’s price since it reached an all-time high last week. But, significant reversals are possible at any time so keep your eyes peeled.
VeChain (VET) Relative Volume
The chart below shows the Relative Volume of VET. It’s an indicator that traders can use to measure how trading volumes have changed over some time. Furthermore, you can compare different trading periods and activities.
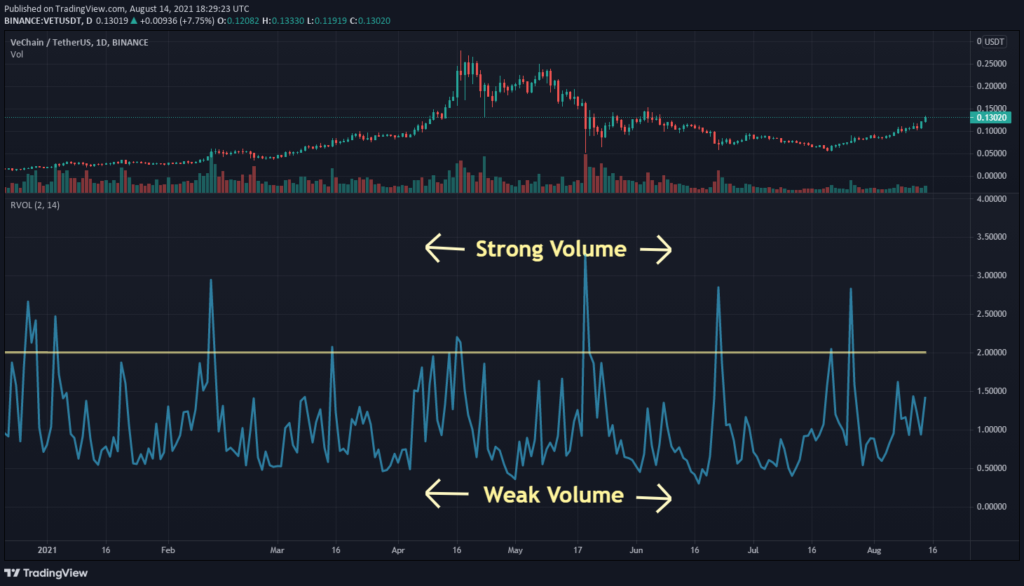
Source: TradingView
Currently, the RVOL of VET lies above the cutoff line representing the more vital participants in the current trend.
VeChain (VET) Moving Average
The Moving Average is a technical indicator that shows whether the market is trending up or down. The chart below displays VET’s moving average, which traders can use to find trends in their investments and make more informed decisions on when they should buy or sell their crypto.
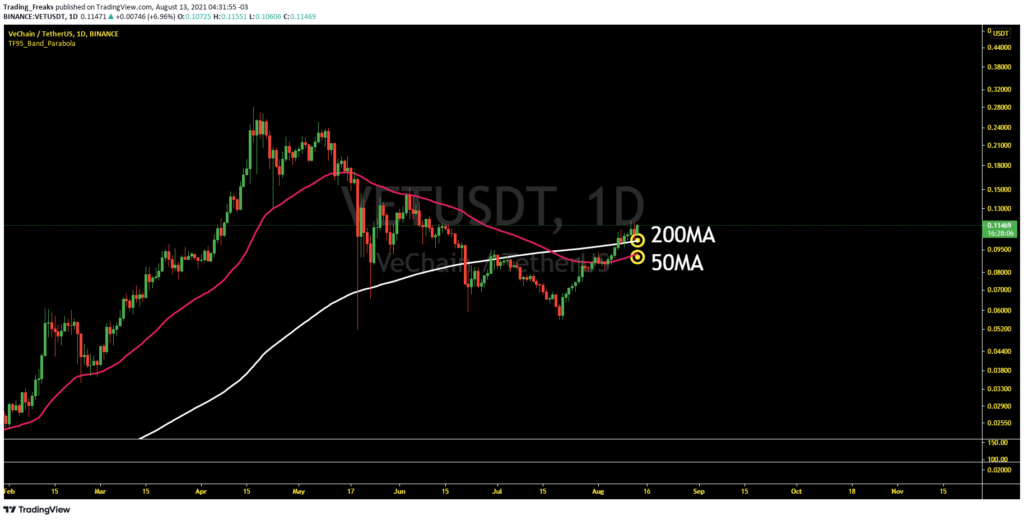
Source: TradingView
The price of VeChain is on an upswing. And it’s not surprising considering that it recently broke primary resistance levels for this cryptocurrency. The VET coin appears to be moving into an utterly bullish state, as indicated by breaking one MA after another.
VeChain (VET) Price Vs. Bitcoin
The chart below compares VET and BTC prices.
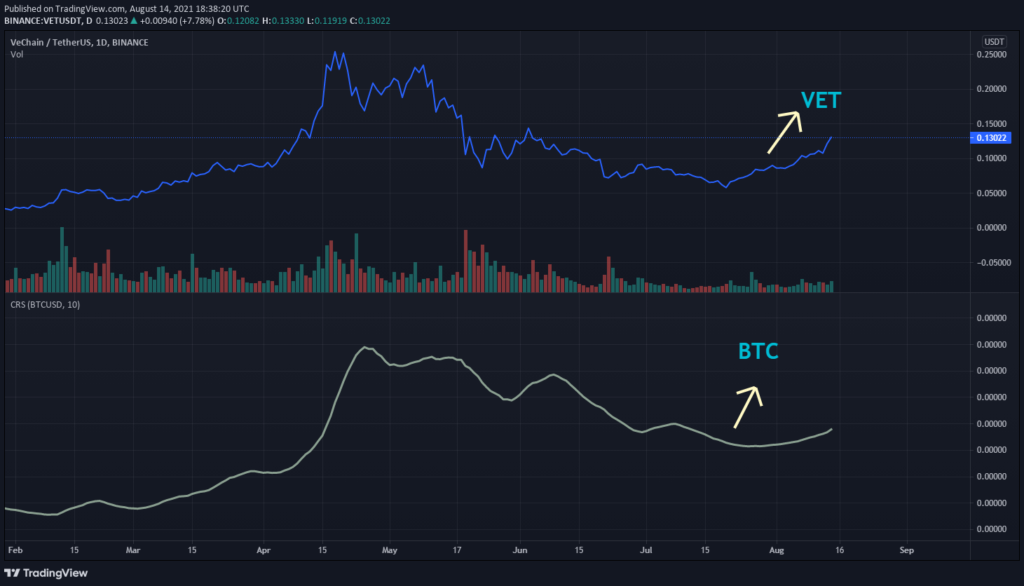
Source: TradingView
The chart shows us that the trends for both Bitcoin and VET are moving together. This means when one goes up, so does their partner, thus, a positive correlation.
Conclusion
With the VET platform’s developments and upgrades, VeChain can have an even brighter future. VET is poised to reach even another all-time high very soon.