


Altcoin WAVES has risen by over 300% since February-end, helped by two defining factors – a rising total value locked and investments into stablecoin, USDN. However, the daily chart suggested that the bullish momentum was dying out as a resistance area approached. A bearish divergence along with the RSI and a weak-looking MACD indicated a period of correction going forward. At the time of writing, WAVES traded at $31.04, down by 4% over the last 24 hours.
The WAVES bull run can be stretched back to the end-February when the altcoin’s price was fluctuating between $8-$12. At the time, the platform’s total value locked (TVL) was hovering slightly less than $1 Billion. TVL is the primary metric used to gauge the health of a DeFi network.
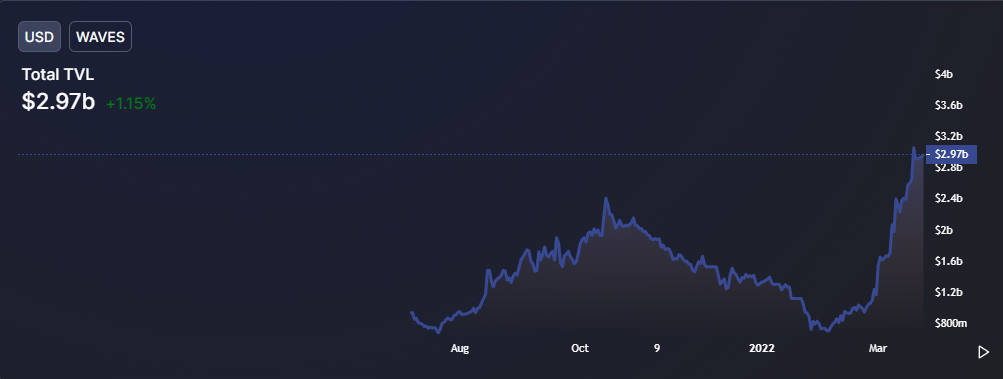
However, WAVES’ TVL spiked by 70% between 22 February and 2 March, and the same ushered a renewed bull run on the chart. The trend remained constant into March, with TVL steadily rising to an ATH of $2.97 Billion. Over 61% of the TVL came from Neutrino, which is the largest liquidity provider on the WAVES network. Notably, the amount of WAVES staked in the Neutrino protocol has risen by 363% over the past month. The platform boasts an attractive average percentage yield of 8%-15%.
Another factor that could be contributing to the WAVES success is Neutrino’s stablecoin, USDN. The dollar-pegged crypto’s market cap has climbed by nearly 10% since February and is now the eighth largest stablecoin in the market. Possible reasons for the rise include rising interest in staking USDN on Neutrino and rising broader market volatility which has pushed investors to park their funds in stable coins during periods of uncertainty.
WAVES Daily Chart
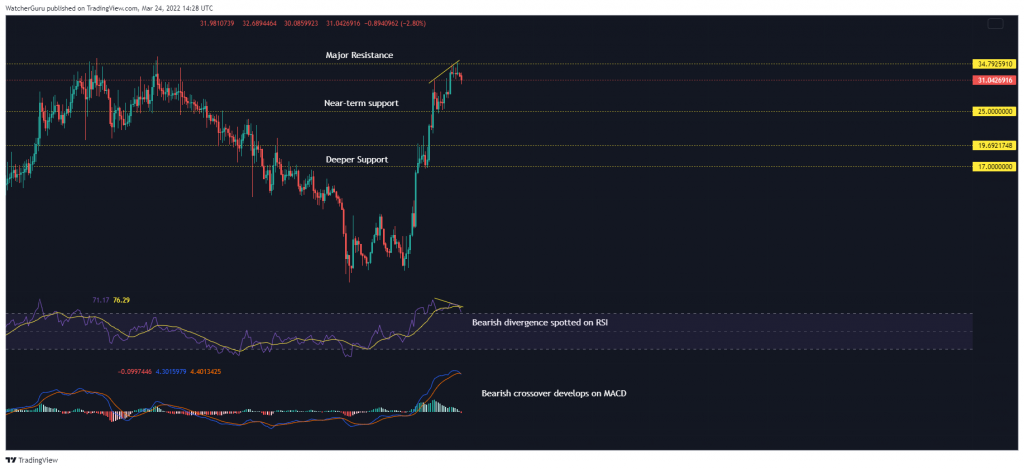
The bullish state of the WAVES market is visible to any observer looking at its chart. A near 90-degree hike showed that WAVES rose by as much as 324% between 22 Feb- 22 March.
However, the price was close to a significant resistance area of $35-$36 and the market was vulnerable to profit-taking. Bearish divergence on the RSI suggested that bullish momentum was waning as the price drew closer to its overhead resistance. Bearish divergences occur when the indicators fail to form a new peak, as opposed to the price. Some traders consider such divergences as an early sign of a changing market trend.
Since the price was still amidst a bull run, placing short-bets is not an ideal situation to earn profits. Hype trading could still be a relevant factor and a simple breakout of about $36 can even trigger a new ATH. Hence, waiting for a correction to draw out and getting in at a cheaper price level is a more logical way to trade WAVES.
In that regard, traders can set up buy orders at near-term support of $25. In case of a deeper correction, buy orders can be set up between $19.7-$17. The area was responsible for creating a 26% bullish candle on 7 March.