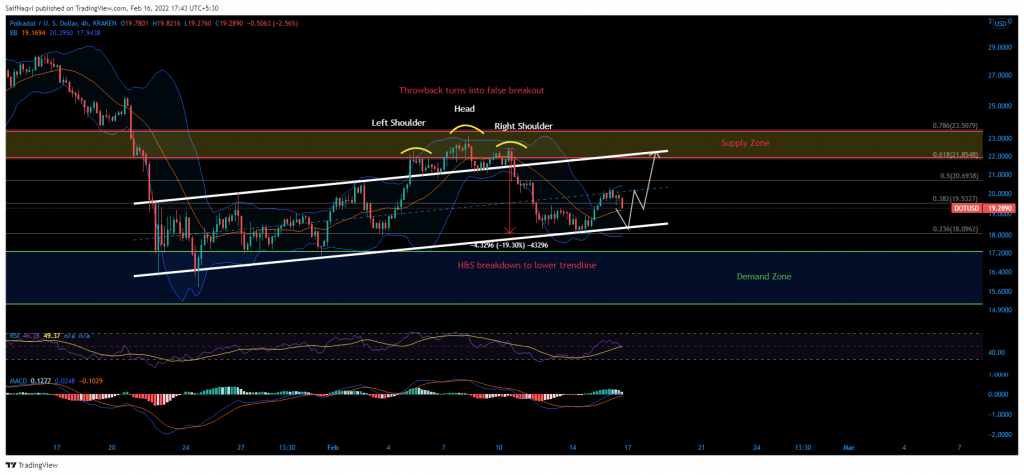
Polkadot was running out of chances to assert a new peak before the weekend. A lackluster breakout was halted within a supply area and bulls faced an uphill task to turn the tide in their favor. With the RSI and MACD looking shaky, DOT was projected to shift lower over the coming sessions and hold within its up-channel.
Polkadot 4-hour Time Frame


A heavily contested throwback to the upper trendline denied Polkadot a chance to zip past a supply zone between $23.5-$22 last week. The formation of a bearish head and shoulders was an unwanted sight for bullish traders, as DOT suffered a near 20% decline between 10-14 February.
A higher low formed at the lower trendline allowed bulls to initiate a recovery, although it was unclear whether DOT would be able to form a peak new in the near term. The 4-hour candles were unable to reapply pressure at the upper band of the Bollinger Bands, suggesting that buy-side momentum was weak. Hence, it was likely that DOT would continue to trade below the 50% Fibonacci level over the near term, with chances of a new low at $18. The outlook would gain more legs if the 4-hour RSI slips below 45 heading forward. In such a case, the index would likely extend to the oversold zone before a rebound. Furthermore, a bearish crossover and developing on the MACD, which was yet to fully recover above its half-line.
However, it’s worth noting that an upside move would be on the table if DOT holds shape within the pattern. A higher-high would be formed at $22.2 during the next upcycle. On the flip side, a breakdown would call for a revisit to $17 or even $15.8 in a severe outcome.
Conclusion
The lack of momentum on either side would likely see Polkadot hold shape within its up-channel after forming a new higher low. However, caution should be maintained if DOT closes below 18. In such a case, shorting would be the way to go.


