The price is hanging by a thread. A last ditched effort at $2,160 can preserve the world’s largest altcoin above the $2K mark, without which the sub $1,800 levels would come into play. At the time of writing, ETH traded at $2,345, down by 10% over the last 24 hours.
Ethereum Daily Chart


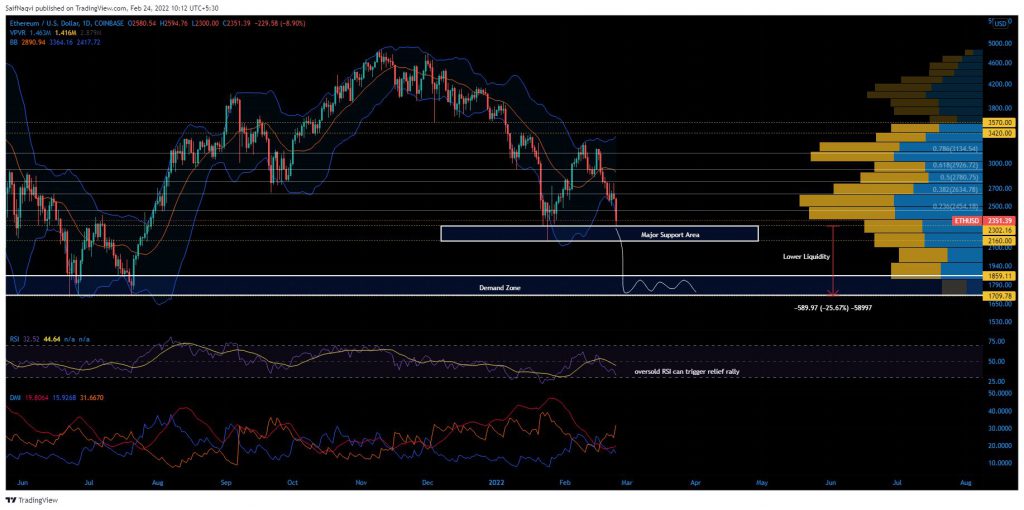
A large red candle on Ethereum’s daily chart was testing the boundaries of a support zone between $2,300-$2,160. The area stood prominent during late January’s crash after spearheading a 53% upwards run to $3,285. With the daily RSI also shifting to oversold territory, chances of another bullish rebound should not be discounted.
Ethereum’s troubles would begin to escalate when and if its price slips below the lower limit of this support zone. According to the Visible Range Profile, traders showed relatively lesser interest for ETH between $2,160 and the next demand zone available at $1,860-$1,700. Historically, the price travels at a faster pace within these areas. The circumstances put Ethereum at risk on another 19%-25% sell-off in case of a close below $2,160.
As highlighted above, a daily demand zone between $1,860-$1,700 would then become responsible for fueling a reversal. The area was significant during May-July, fending off three bearish attacks and setting up ETH’s late-2021 bull run.
Indicators
For the moment, placing long bets between $2,300-$2,160 was extremely risky. The candles were trading at the end of the lower band, signaling an extended drawdown. Furthermore, the Directional Movement Index began to diverge as the -DI line (orange) gained more distance on the +DI (blue). The reading showed that bulls were completely shut off at press time.
Conclusion
Shorting Ethereum below $2,160 made more sense than taking any long calls. Unless a green candle develops within ETH’s current support, investors must brace for an extended correction. The projected outlook would put ETH on course to $1,860-$1,700.


