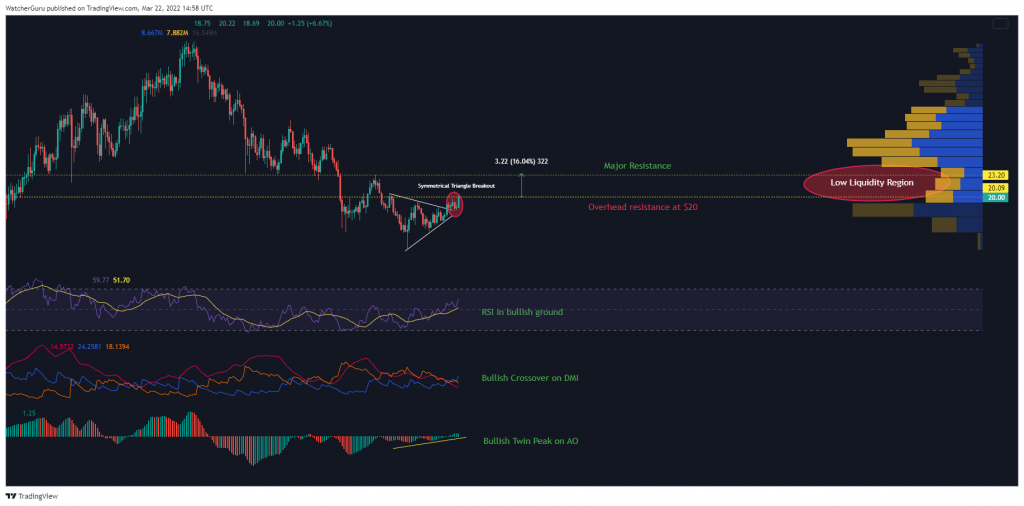
Polkadot is well-positioned to extend its rally on the chart after breaking above a symmetrical triangle setup. The Visible Range profile suggested another 15% ascent was up for grabs provided buy volumes remain consistent in the days ahead. At the time of writing, DOT traded at $20.1, up by 6.3% over the last 24 hours.
Polkadot Daily Chart

Polkadot’s price was parked above an earlier symmetrical triangle after bulls busted the technical pattern on 16 March. The price was now traveling through a relatively low liquidity region as per the Visible Range profile.
More specifically, the area between $19-$23.2 was not a strong contesting ground for buyers and sellers since July 2021, and the chances of a rally extension are higher within such areas. As a general rule of thumb, lower liquidity regions result in increased volatility and create drastic price movements.
Meanwhile, a 50% hike in the 24 trading volumes was encouraging for a sharper price hike. Collectively, the value of DOT transactions across exchanges totaled $1.12 Billion at press time.
Price Strategy


A glance at the chart would be enough to spot a buying opportunity. The Relative Strength Index was amidst an uptrend and sell pressure around 50 had already been overcome. The Awesome Oscillator showed healthy momentum on the bullish side while the Directional Movement Index’s +DI (blue) traded above the -DI line (orange) – a desirable reading for long setups.
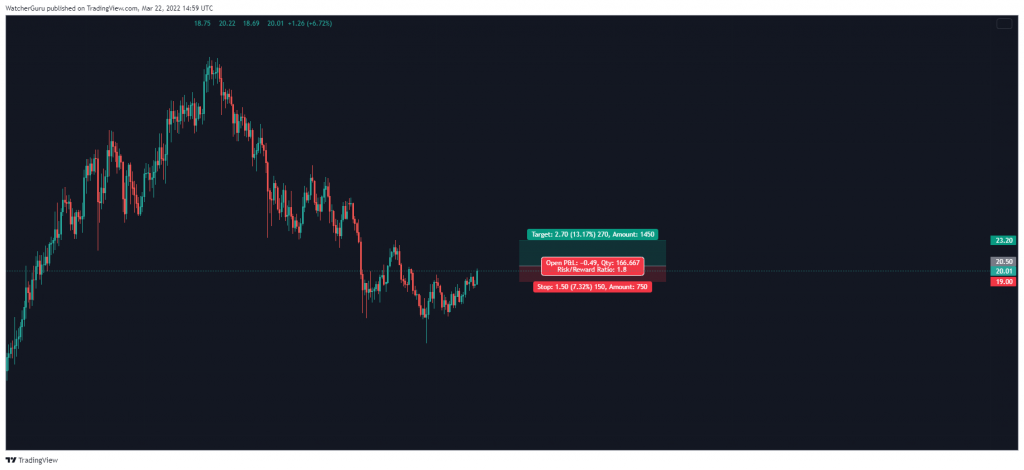
With the abovementioned points in mind, DOT’s market sat up favorably for bullish bets. A buy order can be set at $20.5 and take-profit can be set at a major resistance level at $23.4. However, an immediate resistance was present at $20.2 and the long setup was vulnerable to a premature correction. Hence, risks can be mitigated by placing a tight stop-loss at $19. The trade setup carried a 1.8 risk/reward ratio.


