Shiba Inu’s price kicked off on a positive note on Monday, rising to become the highest gainer among the top 15 coins at press time. The alt breached an ascending trendline after 6 weeks and from a technical perspective, it’s February high of $0.00003537 was the next target on the chart.
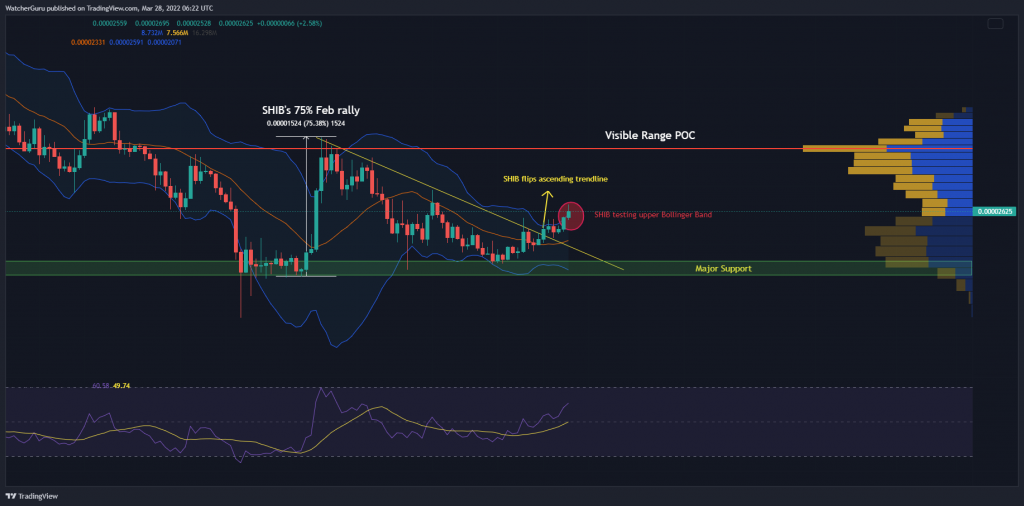
Shiba Inu Daily Chart

During the first week of February, Shiba Inu copped up its biggest rally in nearly 4 months at the time. The price climbed by 75% between 3-6 February, assisted by strong buy volumes across exchanges.
Circling back to 14 March, Shiba Inu’s price was attempting to recreate a similar uptrend. An upwards move kickstarted from major support of $0.00002141-$0.00002068 and the daily candles flipped a 6-week active ascending trendline. The positive development was needed for a continued SHIB uptrend.
Going forward, another 33% ascent would see SHIB revisit its February high of $0.00003537. The level was the most significant point on the chart over the last few months, with the Visible Range’s Point of Control (POC) also hovering close at $0.00003376. Since the POC shows the highest degree of buying/selling pressure at a given point, it is often targeted by traders during an uptrend.
Price Strategy

Given the current market’s health, SHIB was in a good position to realize its goal over the coming week. For one, the daily indicators supported a bullish narrative. The RSI pointed north from 60 and faced no hurdles in its ascent to 70 (refer to earlier chart). The expected climb would bring in more short-term gains for SHIB. Secondly, the upper Bollinger Bands were tested, and the price tended to move higher in such situations.
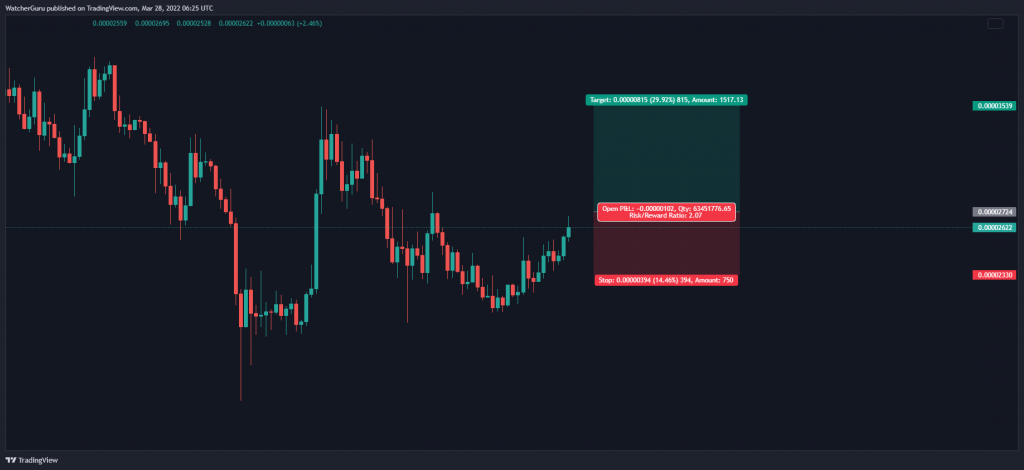
With that in mind, those trading SHIB can place buy orders at $0.00002724 and take-profit at $0.00003539. Stop-loss can be maintained below $0.00002330. The trade setup carried a 2.07 risk/reward ratio.


