Last Thursday at this time, Bitcoin was hovering around $30k. It eventually went on to have a dry weekend but attained $31.7k on Monday. Over the next few days, however, it resumed its correction.
By press time, it had completed a full circle and was back to trading around the same $30k level. After noting almost negligible deviations on the weekly and daily window, the king coin was trading at $30.1k on Thursday.


Even though the direction of the next step forward from here on remains to be unclear, the macro-trend remains to be bearish, and metrics like the NUPL suggest that Bitcoin would go down to the $20,500 range before an actual recovery sets in.
Glitter shines only in the dark, right?
Even though Bitcoin’s prospects do not seem to be all that appealing at the moment, there are quite a few factors—mostly positive—that fundamentally make the current Bitcoin bear market phase different.
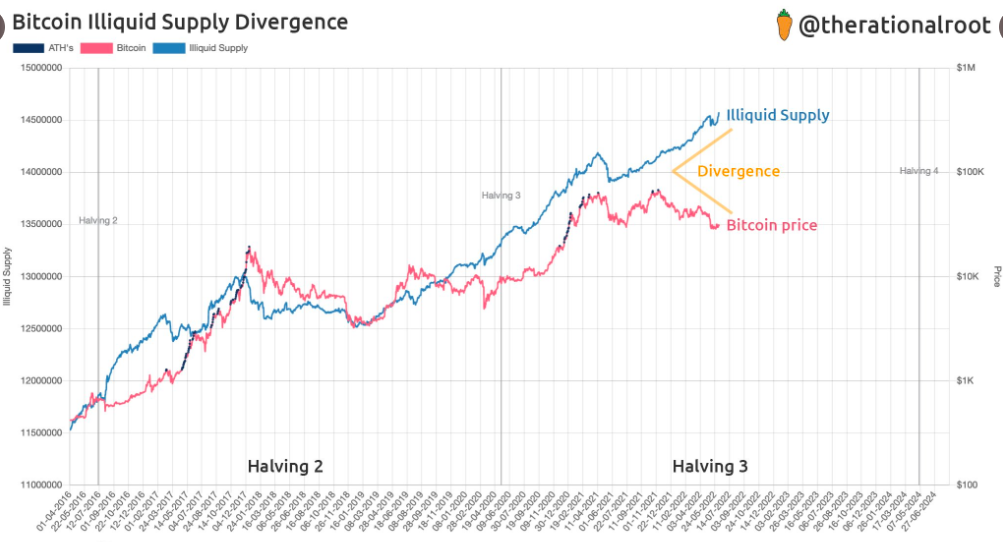
To begin with, let’s analyze the state of the illiquid supply. Essentially, whenever Bitcoins are kept in cold wallets that are off exchanges, the supply becomes illiquid, for it is considered to represent long-term HODLings that aren’t available for selling or trading. The illiquid supply, however, is a part of the circulating supply. So, per the thumb rule, the higher the illiquid supply, the better, for it means the macro HODLing trend is in place.
During bear market cycles in the past, long-term HODLers have capitulated out of fear and abandoned their Bitcoins. From the end of 2017 to the whole of 2018 when BTC shed value and was trading in a bear market, the illiquid supply noted a decline alongside. The same can be evidenced below.
With the market evolving and HODLers understanding the essence of clinging on to their coins for longer durations, they have—at this stage—already started taking custody of their HODLings. As a result, even amidst the falling prices, the illiquid supply has been rising of late. The divergence on the chart below justifies the same.


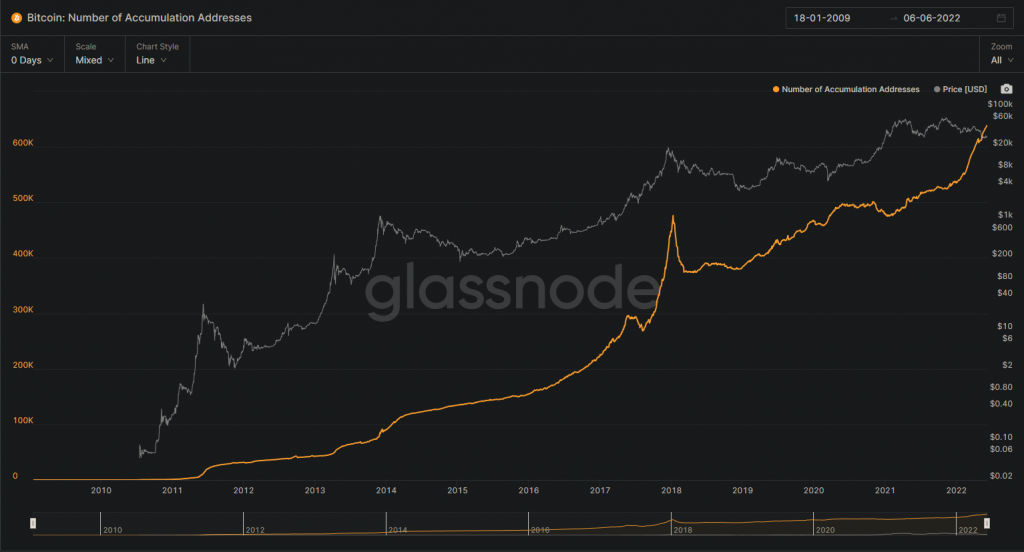
Another important-intertwined factor to consider at this stage is the macro rise in the number of accumulating addresses. Using Glassnode’s data, a particular user took Twitter to highlight,
“Never before in the history of bitcoin has the number of accumulating addresses crossed up past the price on a chart... This may be the start of the biggest bullrun bitcoin has ever seen.“


Et Tu, Bitcoin Lightning Network?
Even though the aforesaid datasets quite evidently highlight Bitcoin’s rising adoption, it wouldn’t be fair to turn a blind eye towards the other feather in Bitcoin’s hat—the improving lightning network capacity.
Bitcoin’s L2 scaling solution, as such, aids users make payments with minimal transaction fees.
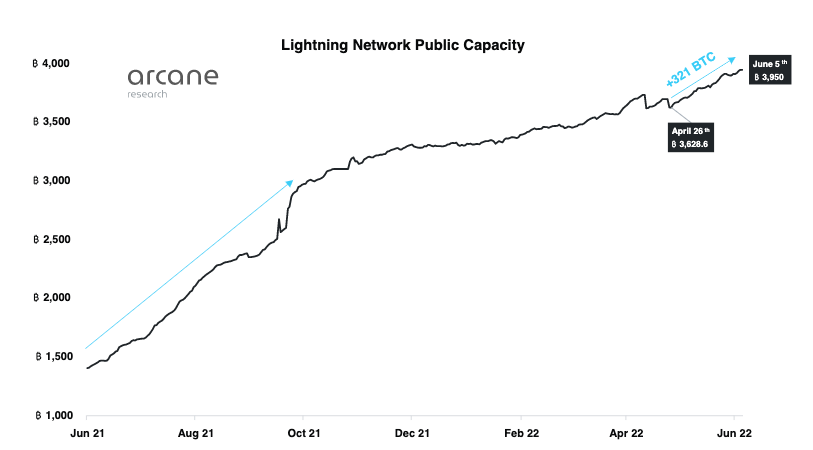
Per a recent Arcane Research report, in the period between 26 April to 7 June, the public capacity on the Lightning Network has grown by 321 BTC. The same essentially represents a 9% growth. In fact, the growth registered in May is the fastest since October last year.
Outlining what this means in terms of adoption, the report highlighted,
“The growing public capacity on Lightning suggests a growing adoption of the Lightning Network.“


Thus, despite it being winter, Bitcoin is already in a period of accelerated growth. And investors—for a change—instead of caring about the short-term action, can lean behind and take a breather, for Bitcoin’s future pretty much seems to be shielded.


