The altcoin market’s turbulent start on Tuesday was spearheaded by some of the biggest DeFi coins in the space. The likes of Solana, LUNA, and Cosmos’ ATOM jumped by over 13% on their respective charts. ATOM, in particular, was expected to overcome an important price barrier and boost its value to $32.7.
ATOM 4-hour Chart


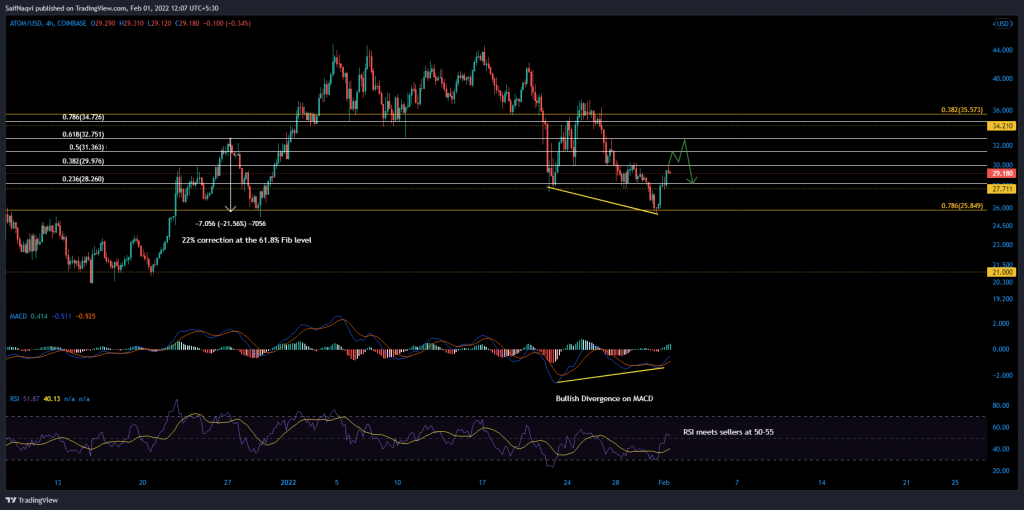
ATOM’s rally got going after buyers mounted a counterattack around the $25-mark. The support’s significance was highlighted through two sets of Fibonacci Retracement levels (calculated from ATOM’s rise from $20.7 to $44.7 [yellow] and decline from $37.2 to $25.4 [white]).
A bird’s eye view of the 4-hour chart showed that ATOM was zoning in on its first test present at the 38.2% Fibonacci level. Since its hike was fortified by rising buy volumes, an upwards breakout would set another 8% surge in motion. However, sellers have been vigilant around $33 in the past and ATOM’s rally would be vulnerable to take profits at the 61.8% Fibonacci level. A quick playback of ATOM’s uptrend in December 2021 showed a 22% correction once the price touched $32.8.
The resulting correction could bear similar results, although support found anywhere above the 38.2% Fibonacci area would be a sign of strength. Meanwhile, the bullish bias would quickly fade if sellers impose losses below $25. The next ideal support was available only around the $21-mark.
Indicators
The 4-hour RSI was on the verge of crossing 55. The development would expel some more selling pressure and allow for a more organic ATOM rally. Furthermore, the MACD’s bullish divergence was followed by a buy signal as the fast-moving line (blue) crossed above the Signal line (orange).
Conclusion
Healthy buy volumes and optimistic 4-hour metrics paved way for an extended ATOM rally. Those late in the bull run can long, once ATOM closes above the 38.2% Fibonacci level. However, take-profits must be reasonable and placed around the 61.8% Fibonacci area. A close below the 23.6% Fibonacci would invalidate this hypothetical trade setup.


