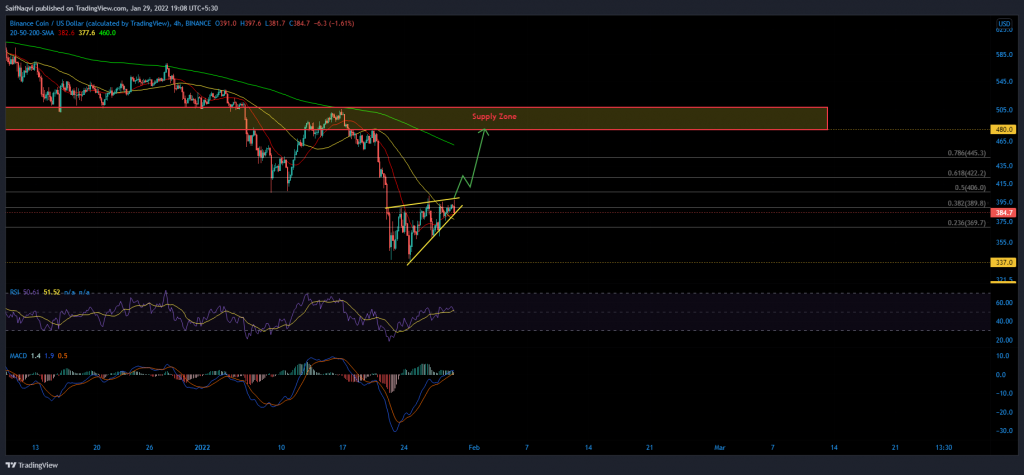
Binance Coin’s wedge has extended into the weekend, with bulls now targeting a comeback to $480. A crucial breakout at the 50% Fibonacci level can generate momentum for an additional 19% hike if bulls remain strong above $422 and $445. At the time of writing, BNB traded at $384, up by 2% over the last 24 hours.
Binance Coin 4-hour Chart


READ ALSO: Has Binance Search for a Headquarters Come to an End?
It has been five days since Binance Coin snapped its last lower low. Since then, bulls have gained a semblance of control, forming higher highs and higher lows within a rising wedge pattern.
The setup was nearing a pivotal moment and bulls would have to prove their mettle at the 50% Fibonacci Retracement level (calculated from BNB’s decline from $480 to $337). Should bulls clear this hurdle, BNB can swiftly cap an 18% hike through a pocket low liquidity between $400-$480. Any additional hikes would largely depend on how the altcoin market functions if Bitcoin holds above $48K.
The 4-hour RSI, MACD, and Awesome Oscillator were equally bullish on BNB’s outlook while a favorable crossover between the 50-SMA (yellow) and 20-SMA (red) supplemented the indicators. However, it’s worth noting that a death cross was active on BNB’s daily chart and an extended rally was unlikely.
READ ALSO: BabyDoge’s Binance Listing Request Ramps Up as Total Holders Reach New High
Should BNB weaken below its 4-hour 20-SMA (red), its near-term outlook would also take an unfortunate turn. A breakdown from the pattern could see bears inflict losses anywhere between 7%-13%. The market would bleed further if BNB closes below 24 January’s swing low of $337.
Conclusion
Binance Coin is preparing for a possible 18% jump after approaching the key 50% Fibonacci level. Traders can start too long once BNB clocks a full 4-hour candle above $406, while take-profits can be set between the 4-hour 200-SMA (green) and $480-resistance. Stop-loss can be kept slightly below the 23.6% Fibonacci level.


