


After copping up its worst-ever week in 2022 earlier in the month, the weekend curse was finally lifted as Bitcoin shifted upwards to $31K. However, sellers were back on the hunt on Monday morning. The industry leader was pairing gains on the 4-hour timeframe and with a bearish technical pattern also in play, these support levels could hold Bitcoin’s value this week.
Bitcoin recovery done and dusted?
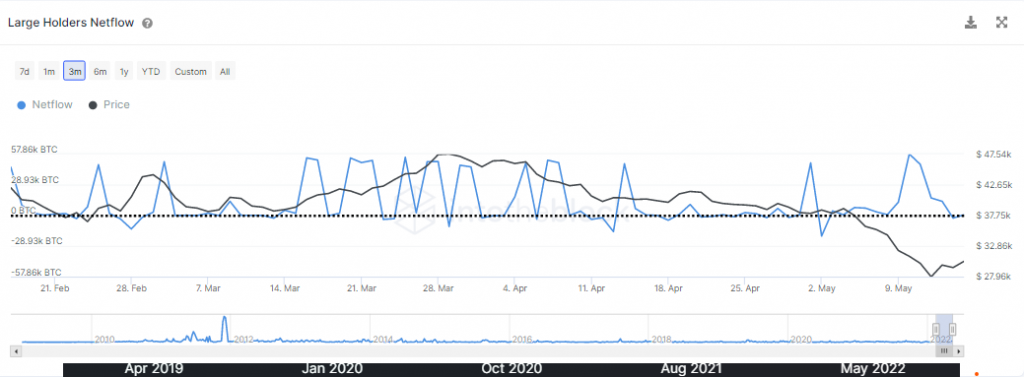
An attractive buy area followed by investor accumulation appeared to have been responsible for the weekend. Proceeding the weekend rise, large holders NetFlow spiked to its highest level in over a month after Bitcoin hit $29K – a historically reliable buy area for investors.
Whether or not the current accumulation pattern would help protect Bitcoin from further sell-offs this week was uncertain but rest assured, retail interest for Bitcoin remains weak. Weekly on-chain exchange net flows were up by $1.5 Billion, suggesting that on a macro level, traders had dumped more coins on exchanges rather than HODL them amidst a volatile market.
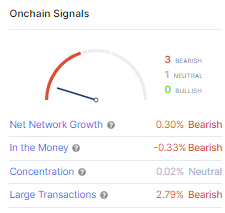
Furthermore, most on-chain signals, including net network growth and large transactions, painted a skeptical outlook despite BTC’s weekend resurgence.
Bitcoin 4-hour Chart
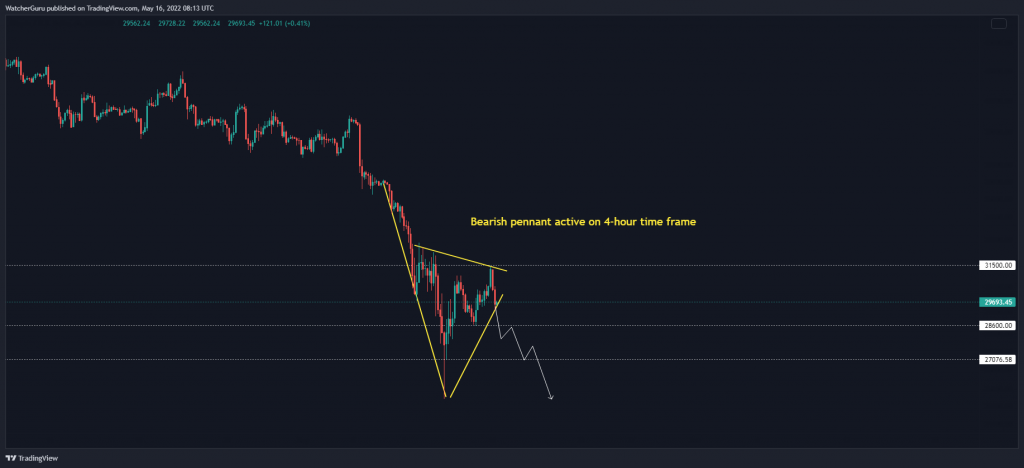
Well, Bitcoin’s recovery was likely to fade and the same was visible on the chart. After tagging $31.5K resistance, a couple of red candles formed on the 4-hour timeframe as BTC slipped below its 20-SMA (red) on Monday morning. A bearish technical pattern was also active – opening the price to more downside action.
Thus, over the next few days, $28.6K-$29K was the most significant support to hold on to. A breakdown would bring forward $27K and $25.4K supports, both of which were yet to prove themselves as reliable defenses. The $24K-$22K price region was the next significant buy area, according to the Visible Range profile.
For bulls to establish command, a move of about $31.5K would provide some winds to their sails but given the bearish structure, gains would likely be limited to the daily 20-SMA (not shown) at $35K.