Bitcoin Cash’s high correlation with the market leader has been a bane of late. In fact, its losses sit much higher than its larger rival. Between early November to 24 January, BCH has plummeted by 65% in comparison with Bitcoin’s 35% decline. Weak on-chain metrics and indicators offered some explanation as to why BCH hasn’t been able to keep up with other alts in the market.
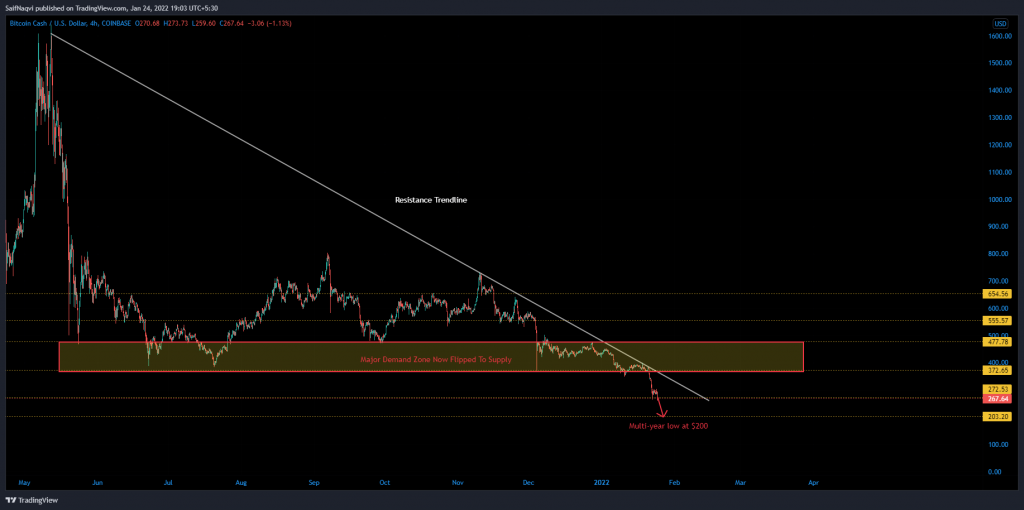
Bitcoin Cash 4-hour time frame


Bitcoin Cash’s chart was a painful sight for a bullish trader. The alt was currently trading at an 83% discount to its May high and sat below a major demand zone between $470 and $370. Although there was some defense available at $268, BCH would likely suffer another breakdown if broader market sentiment continues to be sour. The outcome would put BCH close to the $200-mark, an area that has been untested since September 2020.
On-chain metrics and indicators


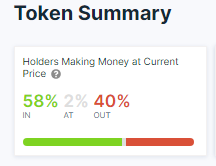
According to IntoTheBlock, over 58% of Bitcoin Cash holders were currently at a profit. Now, the finding often works as a double-edged sword. While these holders could stay put in anticipation of more attractive take-profits, they would be incentivized to sell their BCH tokens and reduce their exposure if Bitcoin continues to shed more value.


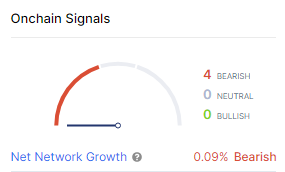
Another major issue is that crowd sentiment continues to be weak amid low network growth. This raises more questions than it answers for BCH’s price trajectory.


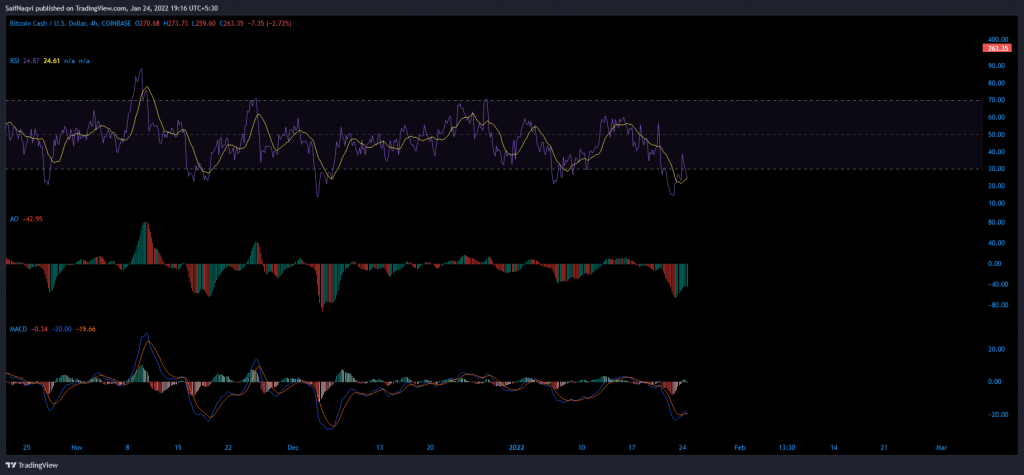
Meanwhile, BCH’s 4-hour indicators bagged some unwanted milestones as well. The RSI, MACD, and Awesome Oscillator were at their lowest point since December 2021 and were yet to develop any clear buy signals. The RSI looked to push deeper into oversold territory while the MACD’s bullish crossover was instantly negated.
Conclusion
Buying BCH is rather questionable at the moment. Its immediate support at $268 is shaky at best and with Bitcoin still, to show any signs of life, BCH could be in for a rude awakening this week. In either case, those looking to set up long trades can do so once BCH touches more reliable support around the $200-mark.


