


Bitcoin and Ethereum are primarily responsible for sizeable collective market movements during a bearish market. After reaching monthly highs respectively, both the assets are currently undergoing correction. While the market desires a long-term recovery, with the upcoming FOMC meeting, BTC and ETH will likely witness another round of dips. Here’s our take on how to navigate through this volatile week.
Ethereum 4-hour time frame
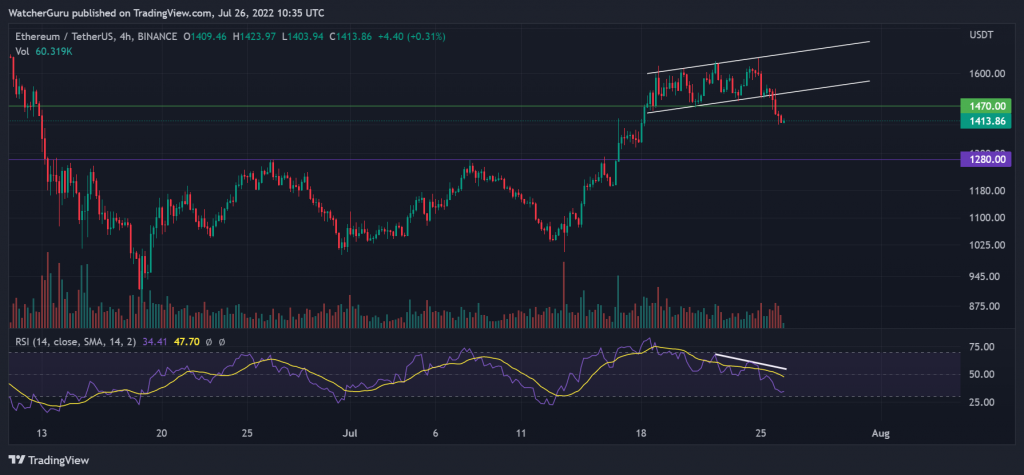
Before we take a look at Bitcoin, let us analyze Ethereum first. The largest altcoin tagged its local top more recently at $1664 on 24th July. Its correction occurred rapidly after forming a supply zone and ascending channel breach(illustrated in the chart). Now for Ether, immediate recovery from $1400 could be viable, but it will likely drop further over the next few days. The purple line indicates the strong support at $1280, which will probably be tested in the days ahead. Hence, looking for a short position is a strong option for traders.
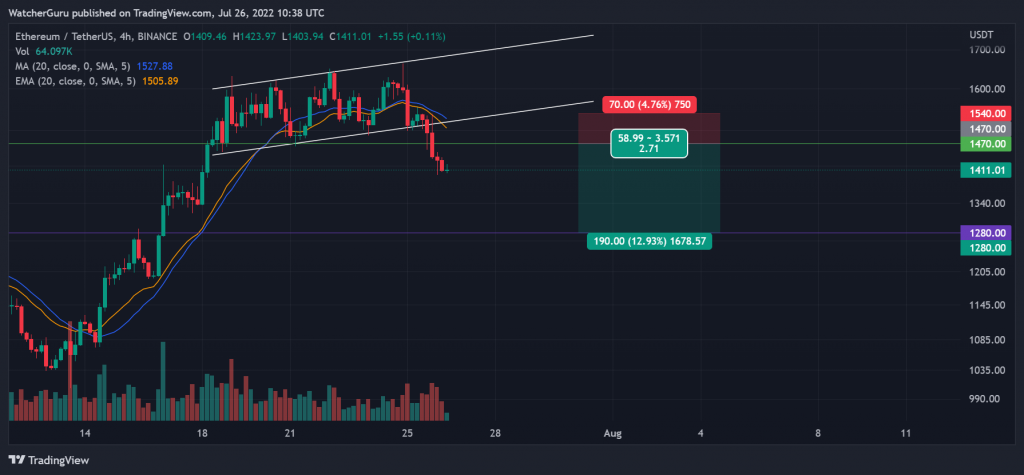
If the chart above is analyzed, an immediate resistance resides around $1470, which could be a good point of entry for the trade. The argument is also placed around the fact that the bearish confluence between the 20-Exponential Moving Average and 20-Simple Moving Average(Orange and Blue line) would likely resist the price at this range of $1470.
Now, $1280 can be taken as the take profit range, and a stop loss can be placed around $1540 in case of a quick turnaround. The trade setup completes an ideal 2.71x Reward/Risk ratio.
Entry: $1470
Take Profit: $1280
Stop Loss: $1540
Bitcoin 4-hour time frame
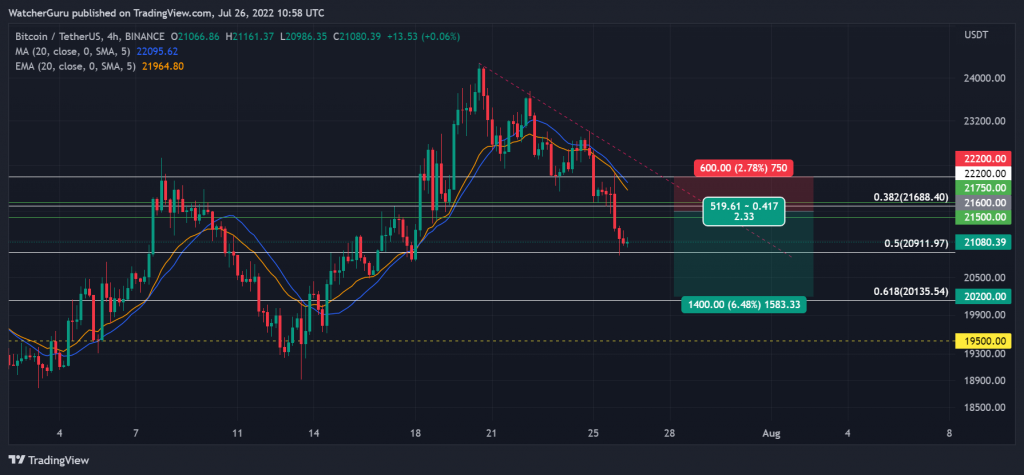
Bitcoin reached its top local of$24276 on 20th July. Since then, the most prominent digital asset has consistently dropped off a declining resistance trendline(red-dotted line). The price also consolidates below 20-EMA and 20-SMA, where SMA is above EMA(a bearish confluence). At press time, BTC looks increasingly weak at its current price range of $21080; as illustrated in the chart, the price may bounce back from the 0.5 Fibonacci retracement line.
With the FOMC meeting in the mix, a short position can be opened for BTC, and the entry can be between $21500 and $21750. Ideally, the work can be opened at $21650, with a stop loss of $22200. Finally, take profits can be around $20200, a range synonymous with the 0.68 Fibonacci retracement line.
Entry: $21650
Stop Loss: $22200
Take Profit: $20200