


Last week, Bitcoin registered a strong upswing of ~9% after the asset briefly brushed its psychological $25,000 support. The current dilemma between investors remains the identification of a trend shift. Since peaking at $31,000 in April, Bitcoin has been on a steady correction. The recent rally came at the back of Blackrock’s spot BTC ETF news, but the asset managed to hold a higher range.
Now, after a sharp 1.17% decline to close last week, investors are eager to identify the next short-term trend. In this article, we will analyze the possibility of a continued bullish trend.
Bitcoin 1-Day Outlook
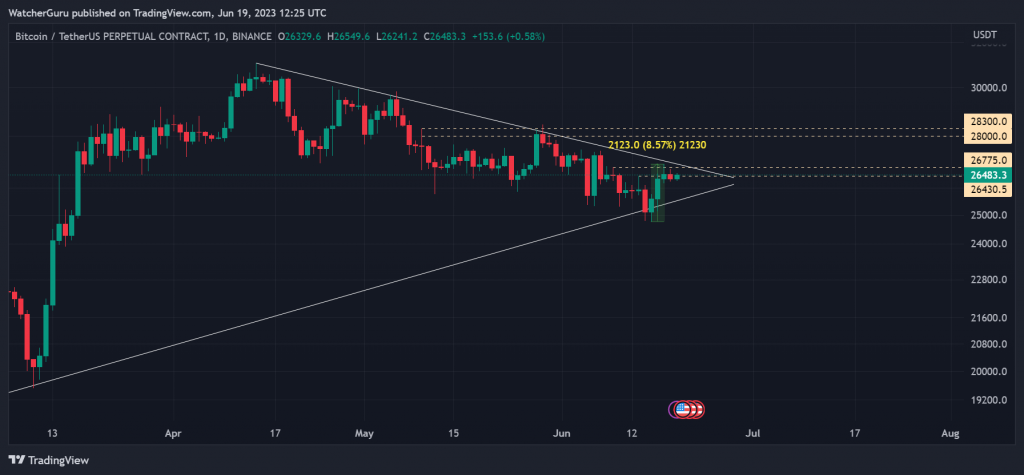
Before identifying the immediate trend, It is essential to understand the current market structure for Bitcoin. Since peaking in mid-April above $30,000, BTC has tested a descending resistance 5 times. Such a scenario highlights the fact that bears have had an upper hand for almost 45 days now. Now, Bitcoins’ current valuation is consolidating under the support line yet again. As illustrated in the chart, its 9% rise came short of breaking a long-term bearish outlook.
Narrowing things down
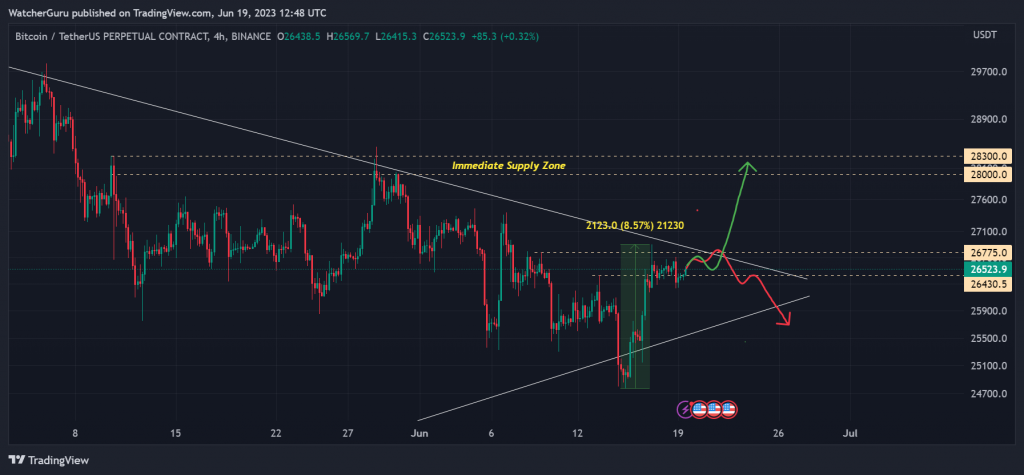
Now, there are a couple of key levels which may decide the trading range for Bitcoin in the coming days. As mentioned earlier, BTC is currently just under the descending resistance. Considering the current long-term market setup, the possibility of another correction(Red path) has a higher chance. The current resistance range between $26775, and $26400 is currently stunting BTC’s rally.
However, if Bitcoin breaks above the descending long-term resistance, the largest asset undergoes a structural shift. The probability of an immediate re-test and rise to $28,000-$28,300 increases significantly. The positive sentiment should be able to carry through and create a new rising trend for the industry.
Yet, the possibility of a continued Bitcoin correction is still high. Hence, it is likely that BTC will probably re-test under $25,000 sooner, than later.
Long-Term Holders continue to ‘Support’
Unlike previous bearish rallies, BTC’s current bearish run has been stretched quite a bit. Other factors such as regulation uncertainty, SEC’s intervention, and a gazillion lawsuits haven’t improved the markets’ image but for the major part of the term, Bitcoin long-term holders have been extremely precarious in terms of selling their bags.
Data from CryptoQuant highlighted that Bitcoin’s LTH behavior might be signaling the beginning of a new bull cycle. There has been a gradual decrease in selling pressure, which has been highlighted by Binarry CDD or Coin Days Destroyed, which is a metric reflecting the intensity of sell pressure from long-term holders. Now, for a major part of 2023, the CDD has continued to fall, which infers a consistent decrease in cash outflow from Bitcoin selling. Now, this metric cannot be the only indicator to rely on, but it is important to take note that CDD has triggered the reversal in previous bull runs.
At the moment, traders should not set a leverage move with high risk until Bitcoin moves above $28,000 or under $25,000.