


Over the past few days, the king coin experienced a substantial decline from a peak of $29,650 to a low of $25,696. Now, Bitcoin’s daily Relative Strength Index [RSI] has descended into an oversold region. It is notable because the last time Bitcoin reached this level was during the COVID-19 pandemic in March 2020.
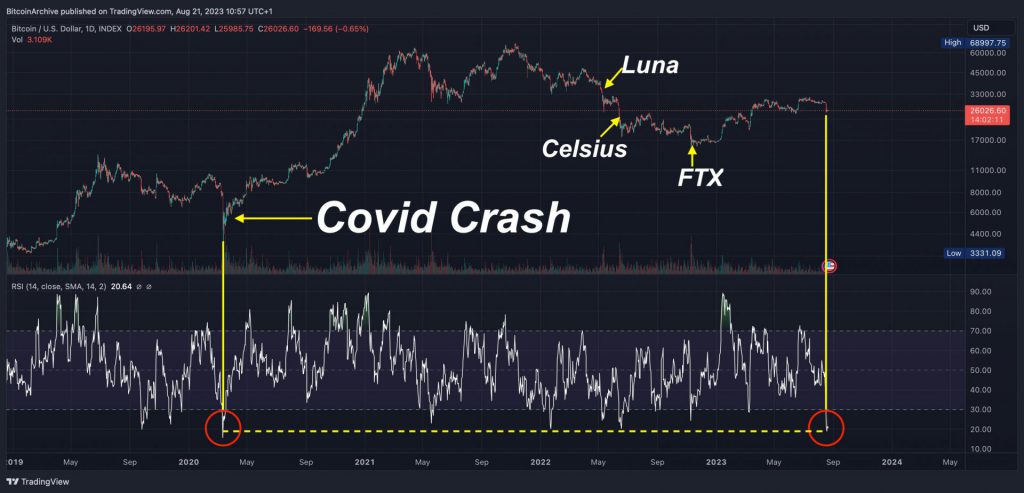
The cryptocurrency community has taken notice of the recent decline in Bitcoin’s daily RSI below the threshold of 20. RSI is a commonly employed indicator. It gauges the velocity and alterations in price shifts. Its scale spans from 0 to 100, where readings surpassing 70 often signal an overbought situation, while readings beneath 30 indicate an oversold state.
Throughout history, instances of extreme oversold conditions have frequently come before substantial price recoveries. This has further sparked conversations about the potential for a bullish turnaround in the upcoming weeks.
‘Fear’ haunts the Bitcoin market
It looks like all these pessimistic conditions are paving the way to a bullish arena. The widely recognized Bitcoin Fear and Greed Index transitioned into the “Fear” region on Aug. 18. It was the same day BTC experienced a sharp drop to $25,000. While this isn’t uncommon, it has maintained its position within that range. The previous occurrence of the indicator displaying ‘Fear’ for four consecutive days took place in January. This was a period when BTC’s value was below $20,000.
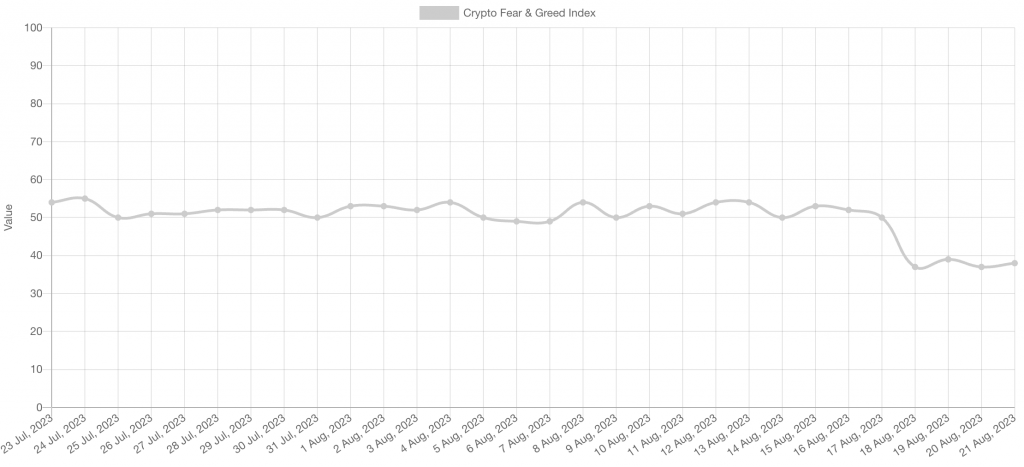
However, Bitcoin’s struggles could soon come to an end. During January 2023, the indicator remained within the “Fear” range for four consecutive days. This was just before Bitcoin initiated a minor bull run that eventually led to breaking the $30,000 threshold. This was a major level of resistance for BTC.
Also Read: Bitcoin: Europe Is the Costliest BTC Mining Hub
BTC’s current correction
Once more, historical patterns might come into play. Benjamin Cowen, a cryptocurrency analyst, revealed an explanation for the recent decline in Bitcoin’s price. Cowen noted a recurrent historical trend that commonly takes place during August and September, leading to a correction in the price of BTC. Similar to all past cycles, Bitcoin consistently dipped below its bull market support band [BMSB] during the months of August and September in the year before its halving.
This decline also aligns with a decrease in the SPX. This has experienced a decline of approximately 5% this month. The analyst highlights that the years leading up to halvings have witnessed both bullish and bearish movements facing significant challenges. He further noted that the purpose of this correction is to eliminate ‘scams and cash grabs’ before the upcoming BTC halving event. Therefore, he was optimistic about a recovery.
Also Read: Bitcoin May Drop 22% Further, Re-test 2017 High