


A chain of Bitcoin corrections has put the market under severe duress as bears run rampant for five consecutive days. The result? Beyond a semblance of a relief rally during early Tuesday, Bitcoin’s long-term outlook was bearish and investors may need to grab hold of a lifeboat in case the BTC ship slips below $29K.
After losses panning between 5-9 May, Bitcoin suffered one of its largest corrections this year on Monday after the price tumbled by 11.%. During such drastic sell-offs, it’s common for some metrics to slip to extreme values, the result of which can lead to a temporary resurgence in price.
Take a look at the Bitcoin NVT ratio as an example. The metric compares a crypto’s market cap and network activity to show whether an asset is trading above or below its intrinsic value. According to the chart, BTC’s NVT was trading at an 8-month low of 328.6, suggesting highly oversold market conditions.
Bitcoin’s stock-to-flow deflection, which compares BTC’s price to its stock-to-flow ratio, also presented similar readings. The metric had touched a 9-month low at 0.334, showing that BTC was just 33% worth of what it should be based on its press time price of $31,000.
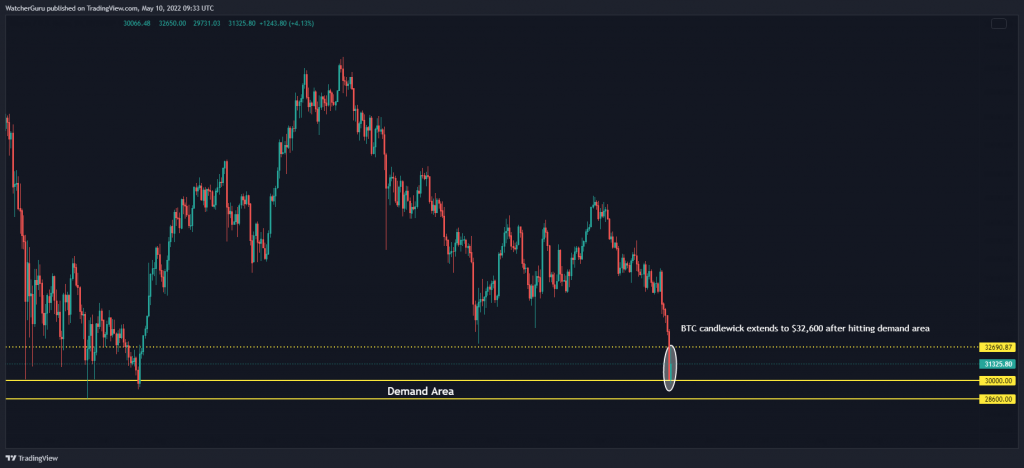
All readings have previously coincided with positive price action as investors start buying a discounted Bitcoin. This was somewhat visible on the daily chart as Bitcoin briefly regained value above $33,000 after tagging an area of demand between $29K-$31K. Notably, the same demand region had triggered a Bitcoin bull run last year.
Bitcoin Macro Outlook
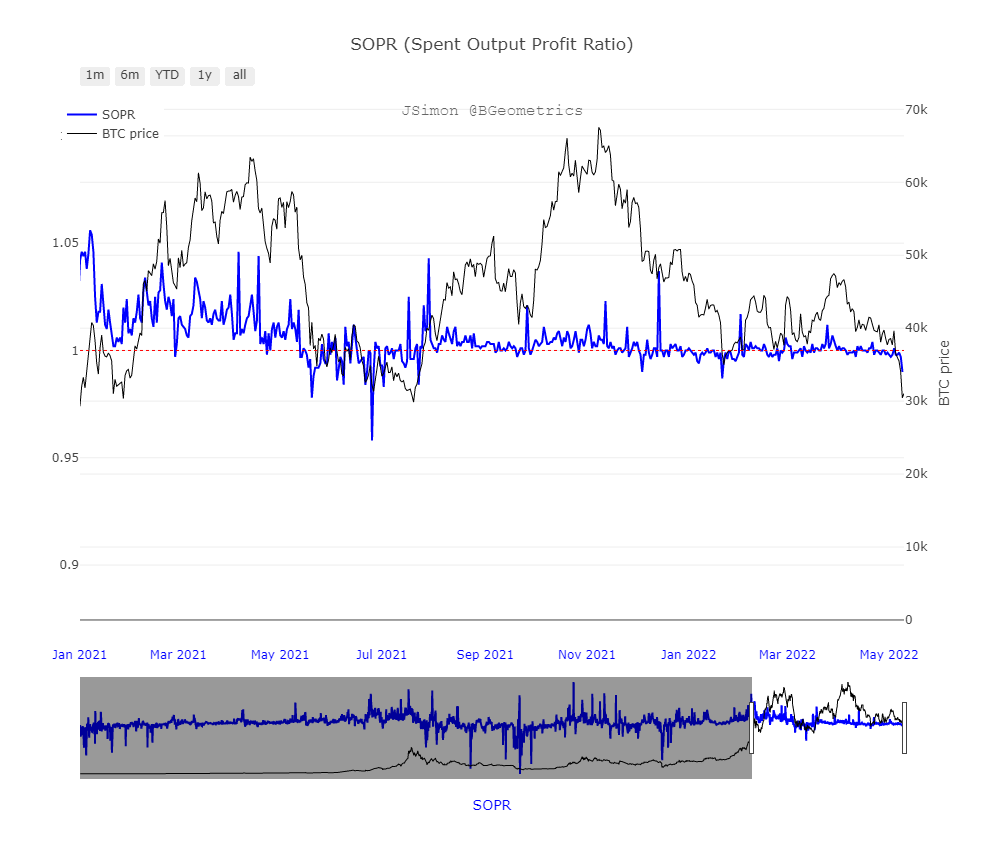
Will we see a repeat of Bitcoin’s rally? Well, that’s another argument. Bitcoin’s Spent Output Profit Ratio, which is a key metric in understanding the overall market trend, didn’t give many legs to a favorable long-term outlook. The metric has slipped below 1 multiple times this year, showing that on average, holders have been selling at losses. Unlike in July last year, the metric was yet to solidify above 1 to mark the onset of a bull run.
Conclusion
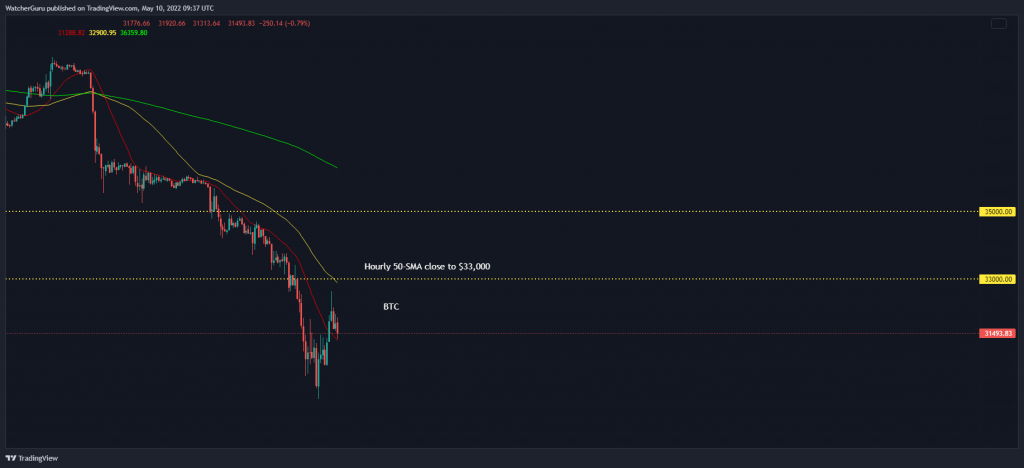
Looking at the buying activity on Tuesday, Bitcoin’s price could briefly enjoy positive price action. The hourly 200-SMA (green), residing close to $33,000 would be significant over the next 24-48 hours. A breakout could even bring $35K in play but any gains beyond that would require a monumental effort.
On a longer basis, Bitcoin could hold within the $29K-$31K range as bulls attempt to outlive selling pressure. If sellers penetrate what is arguably Bitcoin’s greatest defense on the chart, losses could extend up to $22K in a severely bearish outcome.