


Bitcoin’s price has been under constant pressure since a near 30% sell-off was observed on 3 December. Since then, the king coin has formed four lower highs and four lower lows within a persistent down-channel. However, Bitcoin was at a crucial juncture on the chart. The price was testing the upper boundary of its parallel channel and awaited a key breakout to recapture $50K. Moreover, the EMA Ribbons and bullish divergences along the RSI suggested that a possible trend shift was in effect. At the time of writing, BTC traded at $48,660, up by 5.7% over the last 24 hours.
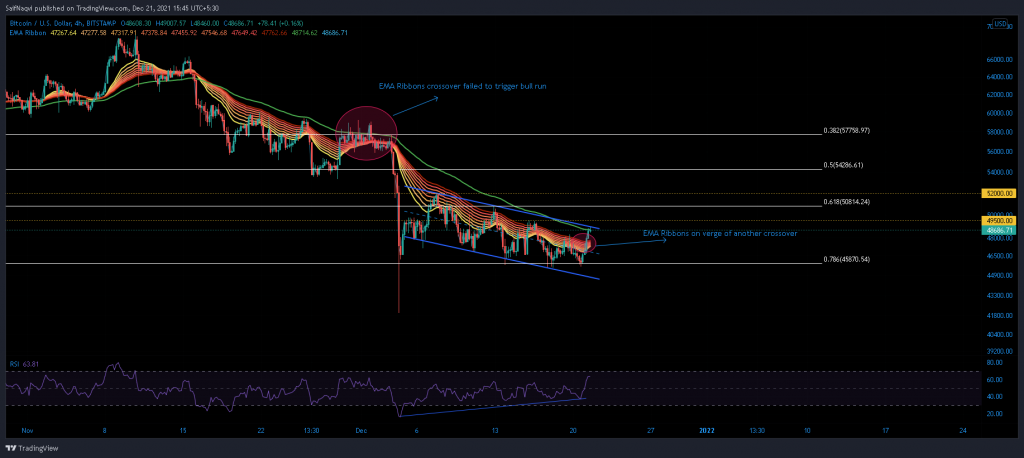
Bitcoin 4-hour time frame
Reasoning
Bitcoin’s down-channel has lasted for over two weeks as bulls have been unable to gather numbers for an upwards push. In fact, a breakout has been rejected on two occasions so far and new lows have been formed at $47,000 and $46,000. Now despite BTC gearing for yet another breakout, bearish arguments can definitely be made. However, a deeper dive into the 4-hour EMA Ribbons and RSI presents an optimistic outcome.
The EMA Ribbons, which comprise a number of several moving averages lines, often ascertain the current trend in the market. When the candlesticks are traded below these ribbons, the asset is considered to be in a downtrend and vice-versa if the candles trade above the MA’s. Apart from these readings, this indicator shows a trend switch once a crossover takes place. Now looking at the BTC charts, a similar crossover was currently in effect. The contracted nature of the bands suggested that selling pressure was fizzling out and that bulls were gaining market control.
The RSI also presented some useful insights. The index formed higher lows while BTC moved in the opposite direction. This gave rise to a ‘bullish divergence’ which indicated that bears were losing power in the market.
Conclusion
Now, these indications do have some caveats attached. BTC’s EMA Ribbons were in a similar position on 3 December but a sell-off was still observed. Hence, a safer bet would be to wait for key levels to be toppled before taking any calls. BTC would first need to clear the confluence of its upper trendline and 89 period EMA.
From there, bulls would tackle 16 December’s swing high of $49,500 and establish a leg above the 61.8% Fibonacci level. An uptrend would be confirmed once Bitcoin retakes the $52,000 level. If BTC fails to initiate a breakout, expect near-term support of $45,870-$46,000 to be tested over the next few days.