


Bitcoin has come under heavy scrutiny after slipping below $36K for the first time in nearly 6 months. The resulting bloodbath was evident on most exchanges as investors offloaded their crypto holdings to minimize exposure. As a result, $10 billion was erased from the total crypto market cap and 330,000 accounts were liquidated over the last 24 hours.
While these milestones would demoralize relatively inexperienced and novice investors, those who have lived through multiple corrections would advise traders to remain calm in face of the storm. Even fewer would be able to rightly predict a ‘dead cat bounce’ – a phenomenon that sometimes unravels after a major decline or a prolonged downtrend.
READ ALSO: UFC Champion Francis Ngannou to accept half his paycheck in Bitcoin
Dead Cat What?
In short, a dead cat bounce is a temporary recovery of an asset after a major correction or a prolonged downtrend takes place in the market. The term comes from a proverb that says that even a dead cat, or, in this case, Bitcoin, would bounce if dropped from high enough. Closing of short-positions, discounted price levels, and ‘buy the dip moments’ are some reasons why an asset rises temporarily before a majority of sellers flush out such weak buy orders, maintaining a larger downtrend.
To best describe a dead cat bounce, Bitcoin’s movement can be traced all the way till May 2021, when the king coin traded at $60,000. A 14% decline on 19 May was immediately followed by a 10.5% hike. Once sellers reignited pressure, BTC went on to register a 17% fall and touched a low of $33,400 on 29 May, discounting its brief rally as nothing more than a ‘dead cat bounce’.
Spent Output Profit Ratio At 6-month low
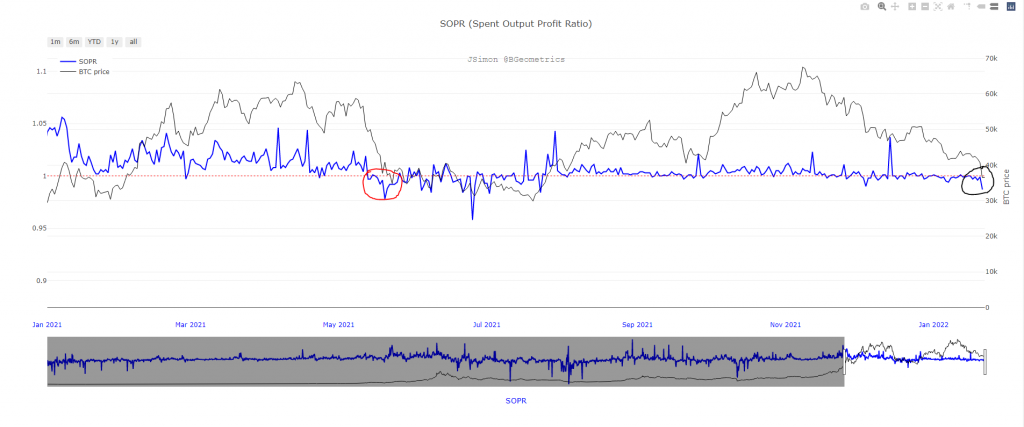
Although it can get agonizingly difficult to project a dead cat bounce, some metrics, such as the Spent Output Profit Ratio, carry a historical significance during such events. BTC’s SOPR slipped to 0.978 during late May (marked in red), which triggered a brief rebound.
READ ALSO: BabyDoge Coin seeks appropriate verification on CoinMarketCap
In simple terms, the SOPR is used to determine whether a particular coin is profitable in a given timeframe. A reading above 1 shows that most coins moved on a particular day were in losses. Currently, BTC’s SOPR clocked in at 0.987 (marked in black), which was not too far off from its May levels. A low SOPR reading (below 1) can incentivize new buying opportunities in anticipation of a rebound back to 1. However, bear in mind that the SOPR could continue to move south if FUD remains persistent.
Oversold RSI, Discounted Price Level Can Lure Investors
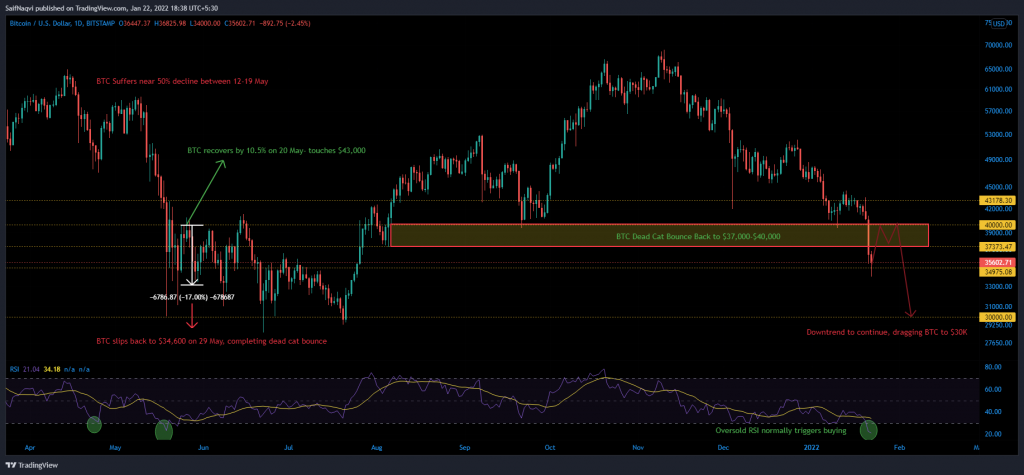
A simple technical analysis showed that Bitcoin currently traded in a region of demand between $34,000-$35,000. The daily RSI was in oversold territory and the same generally lead to buying behavior as well. Should BTC rally over the next few days, its price would most likely revisit a supply region between $37,000-$40,000. Once the short-lived rally fizzles out, BTC was expected to bottom out at around $30,000.
Bitcoin is no stranger to severe corrections or pullbacks. After all, it is one of the most volatile assets in the world. However, some recurring observations can help investors take early positions and prepare for any scenario.