


The Blackrock vs JP Morgan analysis has become a hot topic right now for investors that are actively and carefully looking at financial stocks in the current market environment. As of April 2025, these two financial institutions are trading at quite different price points – with BlackRock sitting at a value of $815.72 and JP Morgan at $216.87. Many investors are, at the time of writing this piece, also trying to decide which of these asset management giants might offer better returns in the months ahead.
Also Read: JP Morgan & Goldman Sachs Warn of 6 Market-Crushing Rate Cuts
Investment Giants: BLK & JPM Key Metrics and Growth Potential for Smart Investors

Market Position and Financial Strength
When looking at the Blackrock vs JP Morgan comparison, one of the first things you’ll notice is that their market capitalization is way different right now. JP Morgan currently maintains a much larger market cap at approximately $573.02 billion, while BlackRock’s market value is around $124.17 billion. This difference also reflects, in many ways, their different business approaches and market positioning.
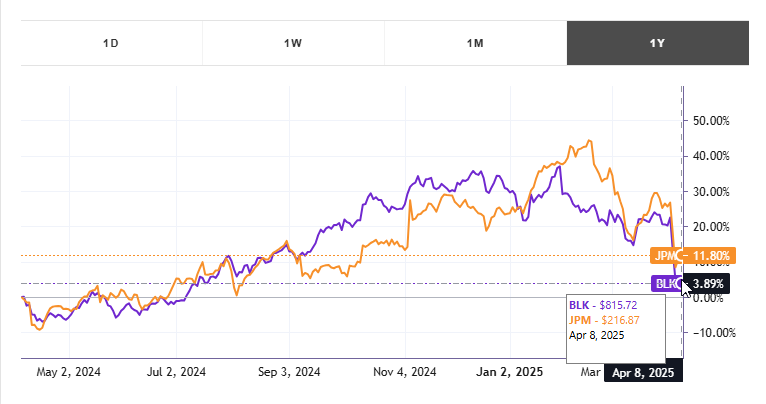
Looking at recent performance data, JP Morgan seems to be holding up better in 2025 so far, with an 8.5% decline versus BlackRock’s steeper 19.99% drop. Many analysts suggest that this investment comparison reflects how these companies are handling the recent market challenges in different ways.
Key Valuation Metrics
When conducting an in-depth Blackrock vs JP Morgan research, it’s worth noting that BlackRock has a higher P/E ratio of about 22.65 compared to JP Morgan’s 12.26. This suggests, among other things, that investors might have different growth expectations for these financial institutions.
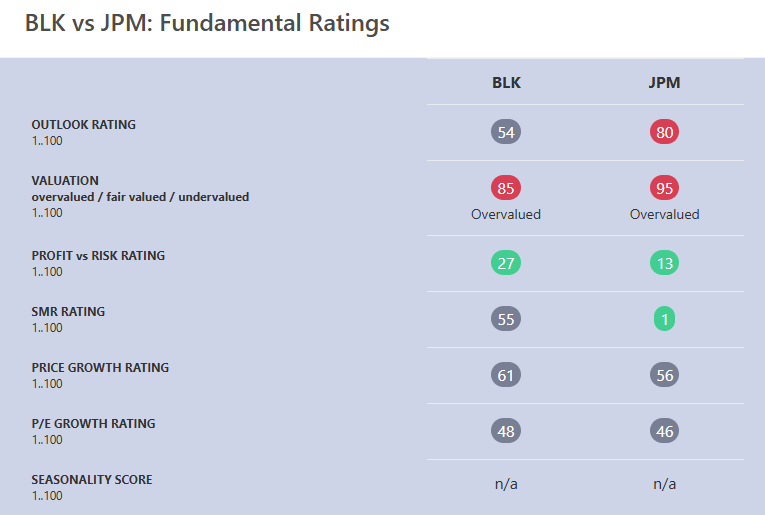
JP Morgan appears to have some stronger fundamental metrics in several important categories right now, and particularly stands out in the SMR Rating where JPM scores a meagre 1 compared to BLK’s whopping 55.
Also Read: Shiba Inu for Retirement: How Much Fresh SHIB Did You Need for $2M Now?
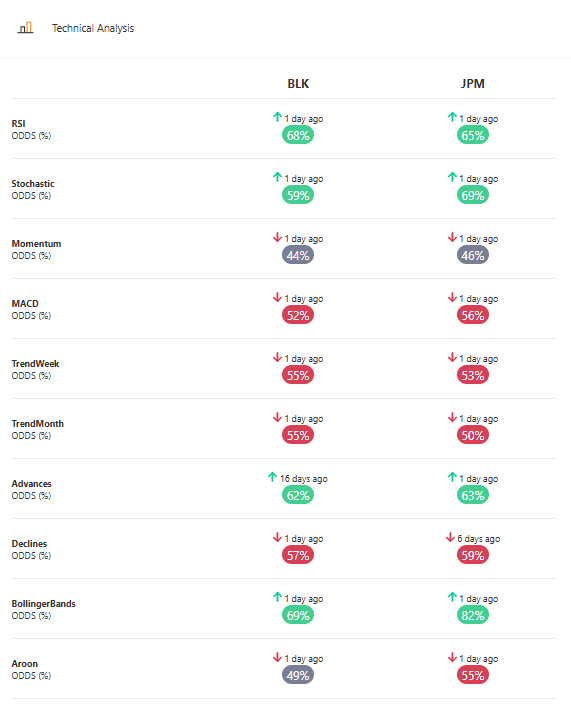
Technical Outlook and Investor Considerations
The technical indicators shown below for both big investment companies paint a mixed picture for investors right now. BlackRock shows 4 bullish and 4 bearish signals, while JP Morgan also displays 4 bullish and another 6 bearish readings as well.
For those that are weighing the Blackrock vs JP Morgan investment options in the year 2025, it’s important to consider that JP Morgan holds greater cash reserves with $26.1 billion while BlackRock also has $10.6 billion, though JPM carries a much higher level of debt.
Also Read: $2K in XRP by 2028? Here’s What One Top Bank Says You’ll Earn
Expert Analysis
Financial analysts have shared some insights about this financial institutions comparison:
Tickeron’s analysis said:
“According to our system of comparison, JPM is a better buy in the long-term than BLK.”
Their technical assessment concluded that:
“According to our system of comparison, BLK is a better buy in the short-term than JPM.”
The investment comparison between these asset management giants will likely continue to evolve, especially as both companies approach their mid-July 2025 earnings reports, which could certainly change the picture for investors in many ways.
Also Read: Why Amazon Could Surpass Nvidia in AI Value by 2030 – Here’s How