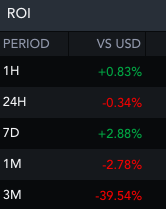
Owing to the inert price movements, the returns fetched by Shiba Inu investors have been quite slender of late. Consider this – over the past week this crypto climbed up the ladder by merely 2.8%. The returns reflected almost the same malnourished value, but in negative, on the monthly window.
The tri-monthly figure too wasn’t all that appealing at the time of press, for it stood at -40%.


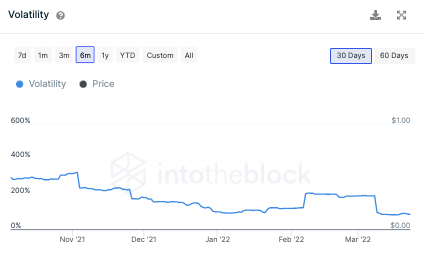
The SHIB market is devoid of volatility at this point, and perhaps that’s the reason why its price hasn’t been able to make impactful swings. As can be noted from the chart attached, during the rally period last November, this metric was hovering around its highs. In fact, during the initial days of March, it did try to pull off a similar feat but was unable to reach the same levels. At the time of press, the volatility was quite close to the multi-month lows.


Additionally, as highlighted in yesterday’s article, Shiba Inu has been trading in a region of high liquidity, between $0.00002240-$0.00002241. Buyers and sellers usually interact more in such areas and the said phenomenon causes the price to move at a relatively slower pace. That’s another reason why we’re witnessing unhurried movements on SHIB’s price chart.
How does Shiba Inu’s path ahead look like?
Even though there’s no room for complacency, SHIB bulls at this stage can take things a little easy. Right above the liquidity zone, Shiba Inu has sufficient space to glide up before being tested.
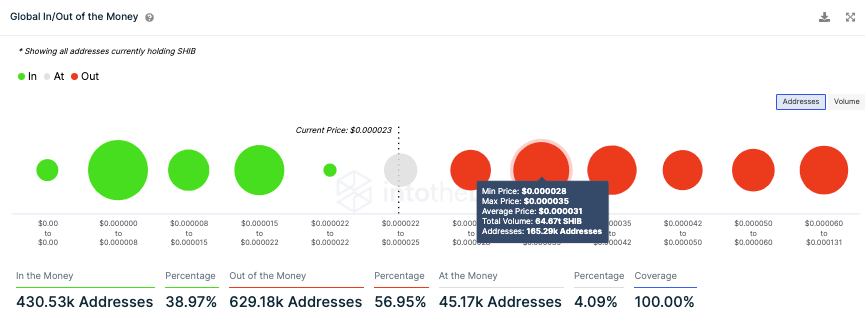
Per ITB’s Global In/Out of the Money indicator, the next strong resistance zone extends from $0.000028-$0.000035. This is the region where more than 165k addresses that purchased over 64.6 trillion SHIB are currently underwater or “out of the money.”
Thus, only when the price approaches the said range, the said investors in loss would want to break even. In effect, the selling pressure would regain steam only as it approaches the said zone. Until then, if SHIB manages to clear all other minor hurdles on its path, it would be able to continue marching up north.


