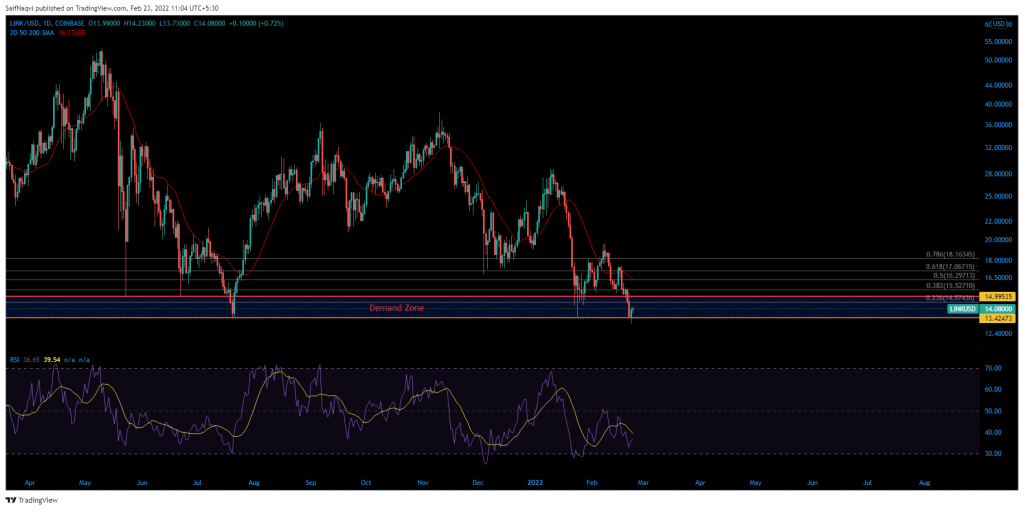
The cryptocurrency market was patching its wounds during the mid-week following Tuesday’s beat-down. Led by Bitcoin’s shift above $38K, the top 25 altcoins witnessed a period of relief on the charts. Chainlink followed its peers and recorded a 6% increase over the last 24 hours. The safety net of a demand zone sat up nicely for LINK, although an extended recovery could take time.
Chainlink Daily Time Frame


Chainlink’s daily chart was much like most mid-cap alts at the moment. A streak of lower highs were active since November as the price slipped below multiple May-July support levels. However, there was one exception. Chainlink’s price had the safety net of a demand region between $15-$13.4, whereas some alts such as ADA had breached below their respective demand regions.
Demand regions are areas where buying activity is relatively higher than other levels. Hence, there is a stronger chance for a bullish reversal once the price revisits such areas.
Whales Buying Chainlink
Coincidently, data from Whalestats showed that the top Ethereum wallets were buying Chainlink’s dip. The coin featured in the top 10 purchased tokens with an average purchase amount of $19,000 and also the top 10 holdings with an average held an amount of $166,000. With that, LINK made up 1.88% of all coins held by the top 1000 Ethereum wallets.
Additionally, Chainlink has seen its fair share of social media mentions over the past couple of days. LunarCrush revealed that LINK’s social volume spiked on 21 and 22 February before slipping lower on Wednesday. The revelation comes soon after the Bank Of America analyst said that Chainlink’s impressive growth is most likely the driving force behind a 313% year-on-year increase in DeFi’s TVL of $203 Billion.
Indicators
Getting back to the chart, LINK’s price looked good to sustain its value above $13.4 as long as the broader market remained safe from another flash crash. Investors should be on the lookout for a higher high above $19.5, as the same would be a sign of a possible renewed uptrend.


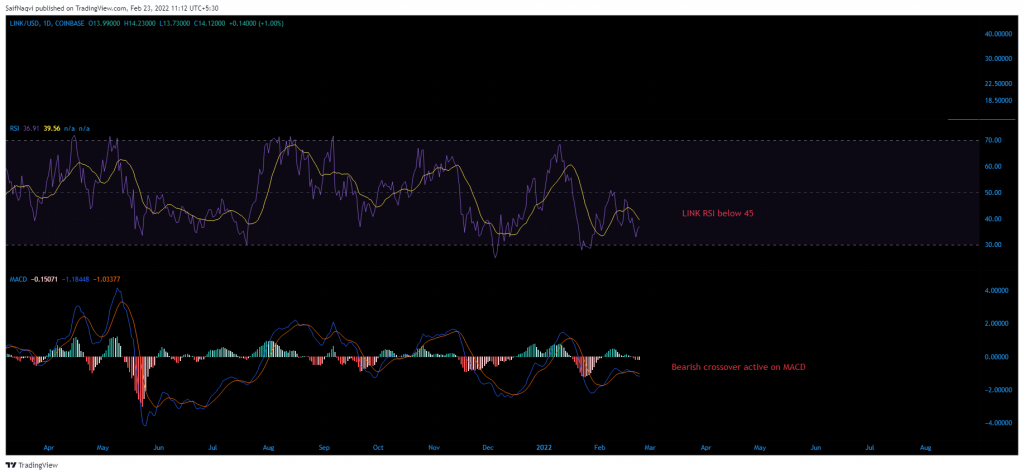
For the moment though, the RSI traded below 40 and aided the sellers, while the MACD flashed a bearish crossover. Their weak positions would most-likely cap upside till the 20-SMA (red) and 50% Fibonacci level at $16.3.
Conclusion
Chainlink’s next step forward was building momentum for a fresh uptrend. Its price sat within a demand zone and looked good for a rally once the broader market turned the risk on. Key levels to watch out for lay at $16.3 and then $19.5.


