


The dynamically evolving nature of the cryptocurrency market often tends to complicate the art of price predictions. Bitcoin’s choppy cycle has already forced experts to change their bullish opinion as we head into the second quarter of 2022, lowering hopes of an altcoin rally. However, like all assets, Bitcoin does mirror historical patterns and the same can help one understand the altcoin market. Recently, analyst Benjamin Cowen suggested that as per BTC’s historical cycle, another sell-off is possible and investing in altcoins is risky at the moment.
Speaking to his followers in a YouTube video, popular crypto analyst Benjamin Cowen suggested that investing in altcoins is extremally risky right now, given the rising chances of a Bitcoin sell-off. The analyst said that if Bitcoin dominance continues to rise as it did in June 2018, a new low could follow and altcoins would mirror BTC’s slide.
“We need to look at what has happened in the past and say if we (Bitcoin) put in a lower low, what happens? The altcoin market against the Bitcoin market changes. The best way to understand that is by looking at Bitcoin dominance…. The dominance right now is at the exact same level it was at in June of 2018 and then the dominance shot up… What happened in June of 2018? That’s where Bitcoin puts in a lower low.”
He further explained that if BTC hit a lower low, its dominance against altcoins would rise and the argument for a bull market would most likely be over.
If Bitcoin puts in a lower low, the structure of the market changes completely. The reason is that the bulls can no longer hold on to the thesis that it is still a bull market because we’re putting in higher lows.
Bitcoin dominance is a measure of how much of the total market cap of crypto is comprised of BTC. Usually, altcoins tend to follow Bitcoin’s price performance during periods of high dominance and vice-versa when the index falls.
Bitcoin Dominance Chart
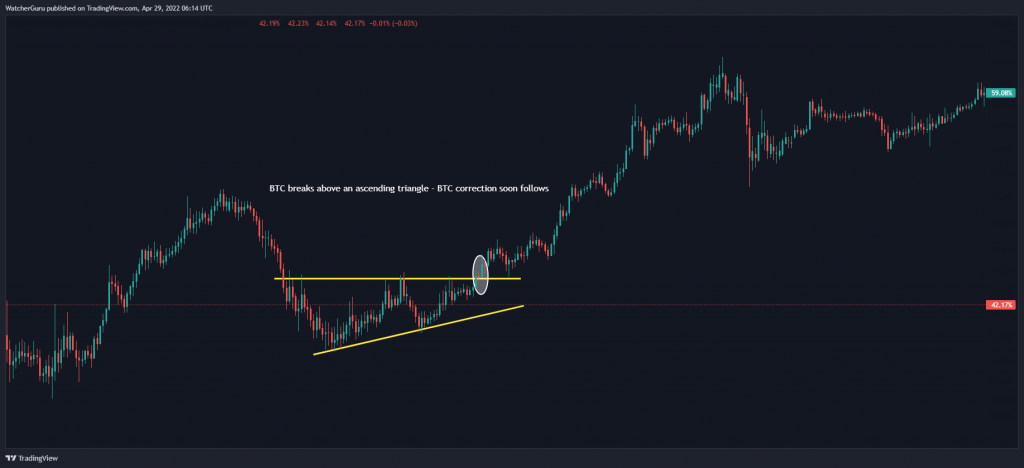
Analyzing the BTC dominance chart back in June 2018, Benjamin Cowen was certainly onto something. The index was trading within an ascending triangle during the time Bitcoin’s price was hovering close to $7,000. Once the index broke above the pattern, BTC slipped by 10% to a fresh low at $6K and altcoins fell across the board.
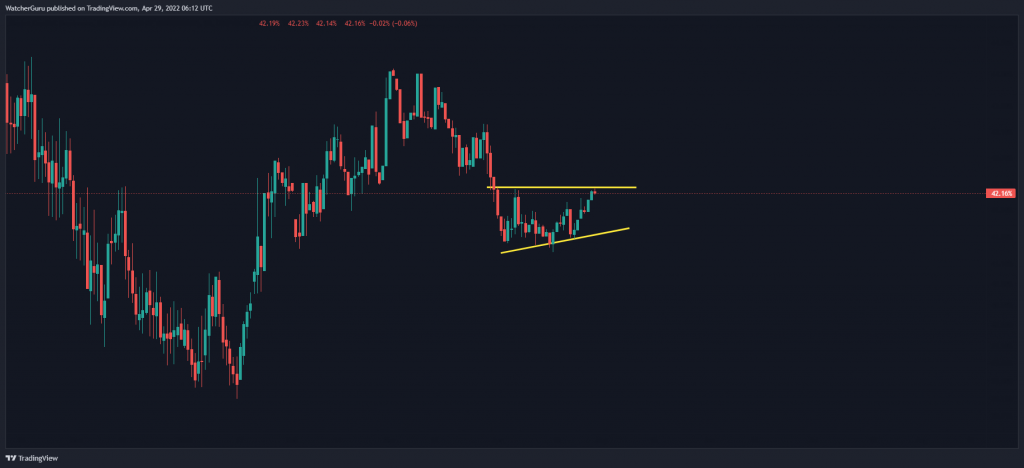
The current pattern was similar to the 2018 levels. Should Bitcoin dominance break above the pattern, history could repeat itself and investors might have to minimize their altcoin exposure to avoid heavy losses.