The cryptocurrency market bounced back on Tuesday morning, with most top-mid cap alts trading in the green at press time. While the recovery appeared to be an interlude to recent corrections, Dogecoin hinted that its revival could develop into a substantial spike going forward.
Dogecoin shapes within a symmetrical triangle

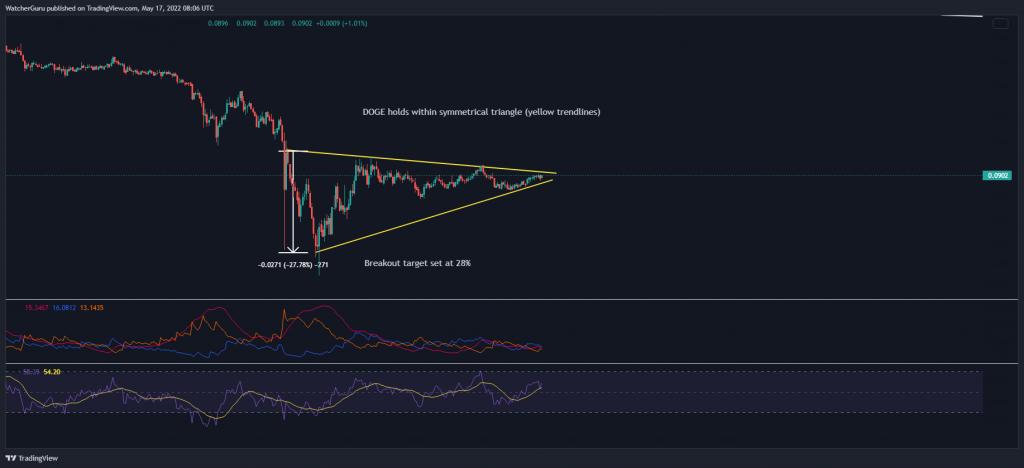
Dogecoin price took shape within a symmetrical triangle on the hourly chart after printing a series of lower highs and higher lows since its 11-12 May decline. The technical pattern is often observed prior to a sharp price swing. Based on the pattern’s height, Dogecoin was in store for a 27% breakout.
Technically speaking, a symmetrical triangle can breakout in either direction so its formation is not necessarily bullish or bearish. However, additional market cues can help one understand where the bias remains.
Now, Dogecoin’s hourly metrics were certainly encouraging for bullish traders. The RSI was amidst an uptrend and had crossed above the 50-55 range – a development showing that the bullish force was becoming stronger with each passing hour. The Directional Movement Index also conferred with the RSI after flashing a buy signal yesterday.


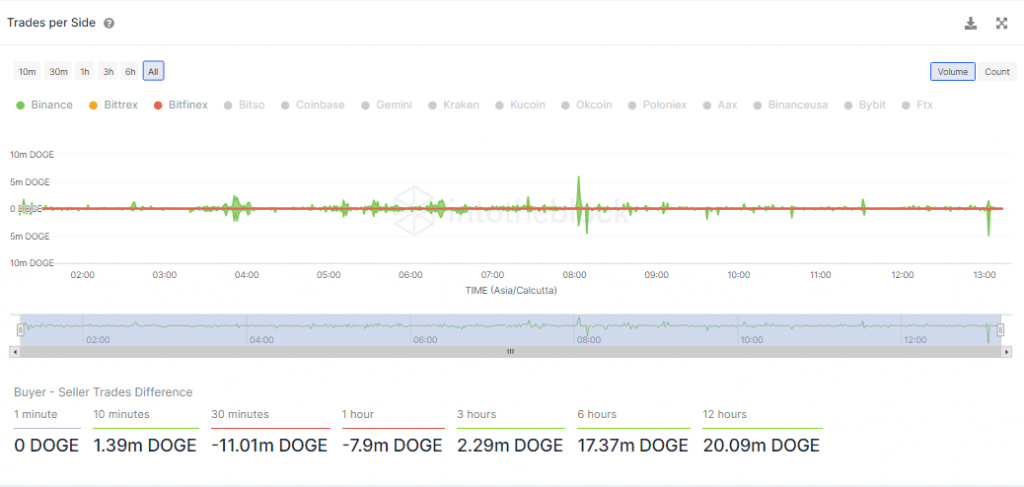
Meanwhile, on-chain data supplemented favorable readings on the chart. The trades per side showed that buy orders dominated on exchanges as DOGE held within a symmetrical triangle.


A near 30% spike in social dominance was another positive, suggesting that DOGE’s market was attracting attention from social media users. The same can trigger prolonged runs as FOMO sets in amongst investors.
Hourly Chart- Scenarios


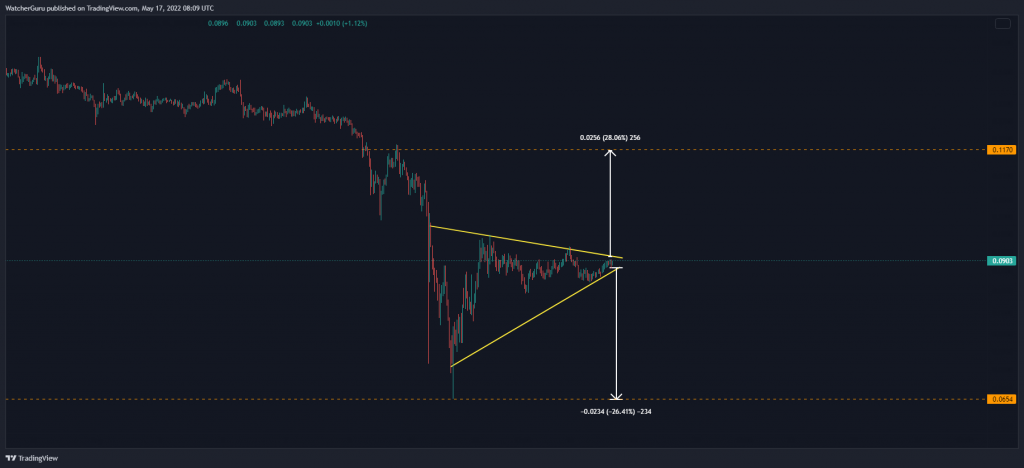
Should DOGE respond positively to the ongoing developments, investors can expect an upwards breakout on the hourly chart. A close above the upper trendline at $0.092 forecasted a 27% hike to $0.117- based on the breakout target.
However, one should not discount a move to the downside given broader market conditions. At press time, Dogecoin shared a high correlation of 0.80 with Bitcoin, and should the latter lose sight of $30K once again, other altcoins, including DOGE, may be forced to move against individual trends.
A downside move would set DOGE back to its 12 May low of $0.654 after a 26% correction. A support region of $0.045 would likely contain additional losses but DOGE’s market structure could shatter in case of another breakdown.


