


Dogecoin is a popular meme coin that has inspired many other animal-themed cryptocurrencies. DOGE paved the path for the numerous cats and dogs that are flooding the meme coin realm. Meme coins were primarily developed as a joke, as their name suggests. However, over time, they have gained prominence as an important niche.
While other meme coins come and go, Dogecoin has earned its reputation among the meme coin community. Even amidst the recent meme coin frenzy, DOGE has not been its best-performing situation. However, Bollinger Bandwidth, a technical analysis indicator, indicates that it could be the silence before the volatile jump.
Is Dogecoin bracing for a volatile jump?
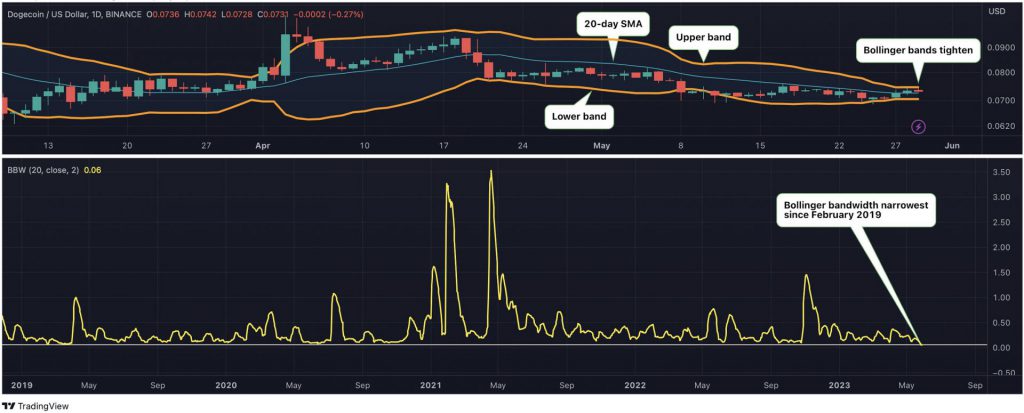
The Bollinger Bandwidth is a measure of volatility in relation to price movements. It is determined by dividing the difference between the Bollinger bands by the 20-day simple moving average (SMA) of the crypto asset price.
According to TradingView, the daily chart of Dogecoin indicates that the Bollinger bands have recently contracted, resulting in a decrease in the bandwidth to 0.06. This is the lowest level observed since February 2019.
The indicator is a likely indication that Dogecoin could explode anytime soon. According to the analysis, the move could either be bullish or bearish. The latest data from CoinMarketCap shows that DOGE is up by 1.33% in the last 24 hours and is trading at $0.07338.