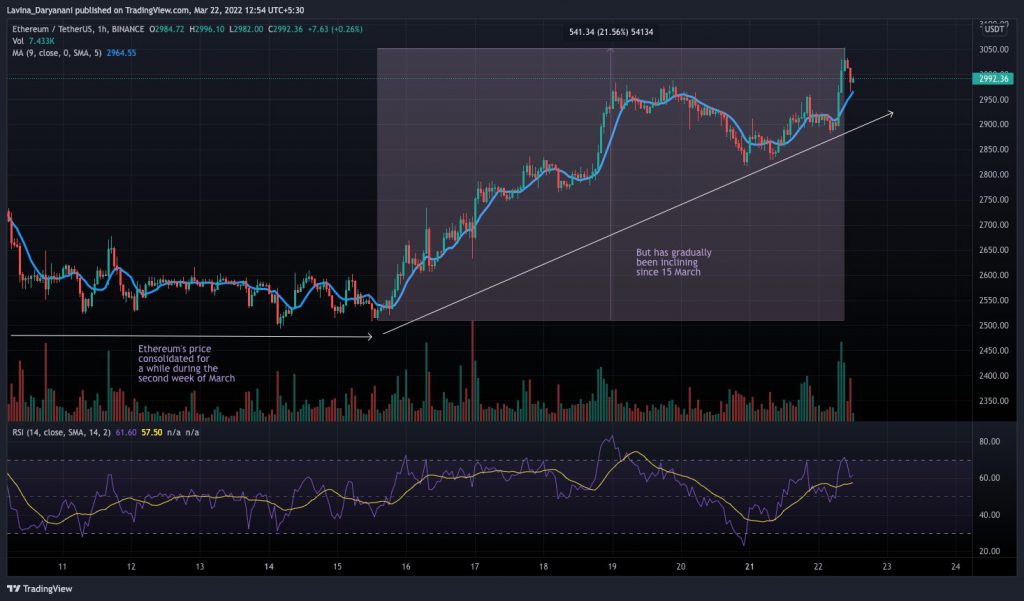
On Tuesday, for the first time since 2 March, Ethereum’s price breached the $3k level. The upswing was a result of the broader market pump. After noting a 2.43% incline in 24-hours, the global crypto market cap reflected a value of over $1.92 trillion at the time of press.
Ethereum’s pump over the past day wasn’t completely out of the blue. The king alt had gradually been ascending on its charts since 15 March. In effect, the rally until the $3.05 peak was attained today amounted to over 22%.
The retracement was, nonetheless, quick to follow on the short-time frame chart. Ethereum had already sneaked back below $3k at the time of press. In fact, the RSI reading too was witnessing a pullback. While writing, it stood midway between the overbought and neutral zone.


RV slips into the negative zone
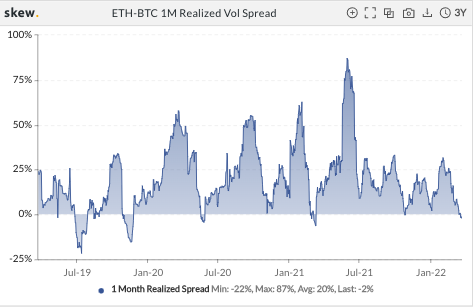
Quite an interesting trend has currently emerged on the ETH-BTC 1M Realized Volatility [RV] Spread. When last written about at the beginning of March, this spread’s reading was slightly below 10%. However now, for the first time in a year, the RV has dipped into the negative territory.
Now, if the chart attached below is observed, it can be noted that every time this metric has dunked into the negative territory, it has rebounded and gone to create new highs within a few weeks/months. In effect, Ethereum’s price during such periods has swung up/down with more thrust when compared to that of Bitcoin.


During every period, however, market conditions have been different. Last year’s rally, for instance, was followed by a bullish period noted during the last few months of ’20. However now, we’re emerging from a bear market and what follows next would highly depend on how Bitcoin performs.
So, when the Bitcoin tide rises, most altcoins boats would be lifted alongside. In such a scenario, after a concrete uptrend is established, Ethereum can be expected to take the lead. However, if Bitcoin retraces, Ethereum’s bullish prospects would end up denting alongside.


