


Since the beginning of February, Bitcoin has twice tested the $46,500 range. On both occasions, the asset suffered a massive correction thereafter, which thwarted its long-term recovery prospect. While most investors are hoping for a turn-around, macro-economic uncertainties due to the ongoing war between Russia-Ukraine are causing major distress.
However, keeping an eye on Bitcoins’ Death Cross may allow investors to catch a reversal before others. In this article, we will identify what a Bitcoin Death Cross indicates, and how it is significant in the current trend.
Bitcoin-Death Cross; a forgotten trend or existing direction?
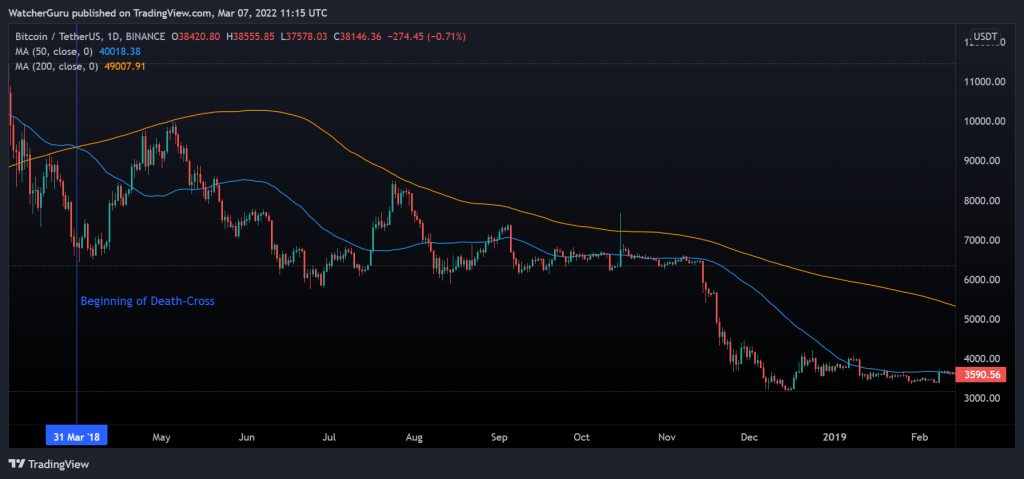
Bitcoin Death Cross is a simple relationship established between the 50-Simple Moving Average(Blue line) and 200-Simple Moving Average(Orange line). Whenever the 200-SMA crosses above the 50-SMA, it often leads to a strong bearish rally. As illustrated in the chart above, on 31st March 2018, a Death-Cross was witnessed. BTC’s downtrend lasted for more than a year and the market reversal took place only in April 2019. During that rally, BTC lost more than 60% of its value.
What opposes the Death Cross?
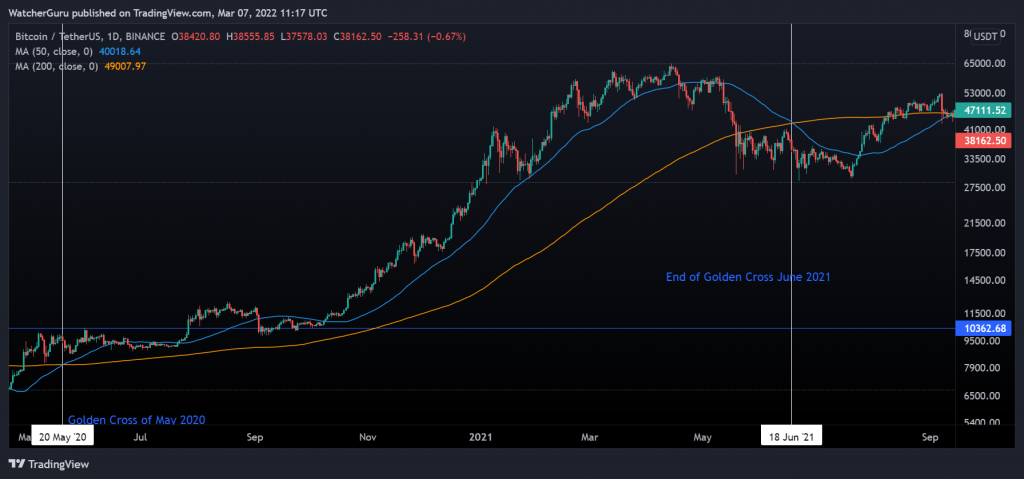
On the flip side, the opposite of a BTC Death Cross is a Golden Cross. During a Golden Cross, the 50-SMA crosses above the 200-SMA, initiating a strong bullish rally. May 2020 is a good example(above chart), where a golden cross triggered a bull-run to $64,000 and lasted till June 2021. Both the trends are strongly correlated with the SMA, and Investors can use them to analyze the long-term trend of BTC.
Current Market Scenario for BTC
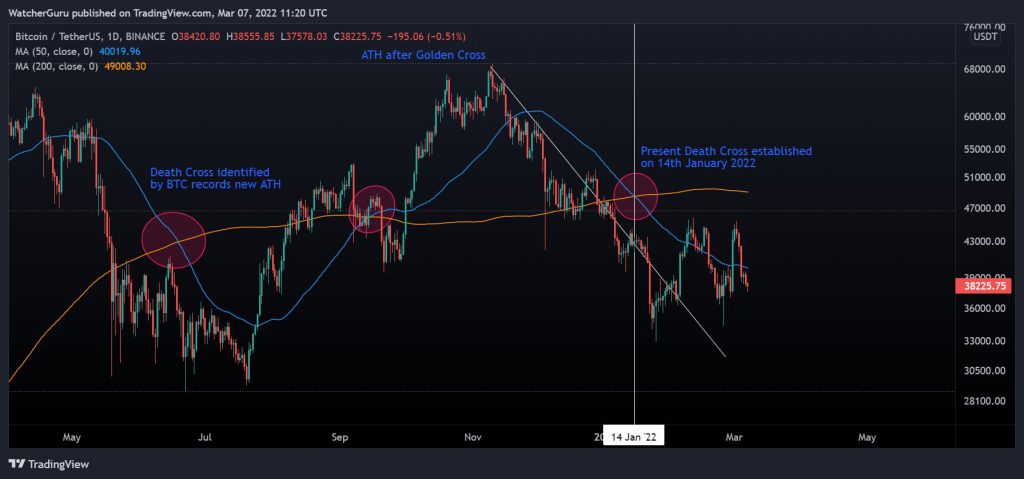
Now, it is important to note the following a Golden Cross or Death Cross is not a full-proof strategy. The June 2021 Death-Cross(above chart) did not last long and BTC reached a new all-time high in November 2021. However, the all-time high was registered only after a Golden Cross was observed. Now the current situation indicates, Bitcoin is under a Death-Cross trend.
So technically, Bitcoin may continue to drop going forward, unless it breaches $50,000 soon, and a Golden Cross is formed.