


SafeMoon V2’s price has enjoyed an uptrend since mid-May, with prices rising by as much as 290%. With the daily chart presenting bullish signals and a potential golden crossover in store, SFM was open to a 36% rally over the next few weeks.
Daily Chart
Up until mid-May, the narrative for SafeMoon V2 was strikingly similar to other alts in the market. The price continued to slump to new bottoms amidst a bearish broader market cycle and tagged a 4-month low on 12 May. However, the counter-response from bulls was strong. Since touching monthly lows, the price rallied by as much as 290% from $0.0002647-$0.00105 – its largest rally since January.
However, bullish momentum appears to have slowed down following a 22% daily correction on 26 May. The last 6 six days resulted in three red candles and a fourth was currently in development. With that said, there were still a few reasons to remain optimistic.
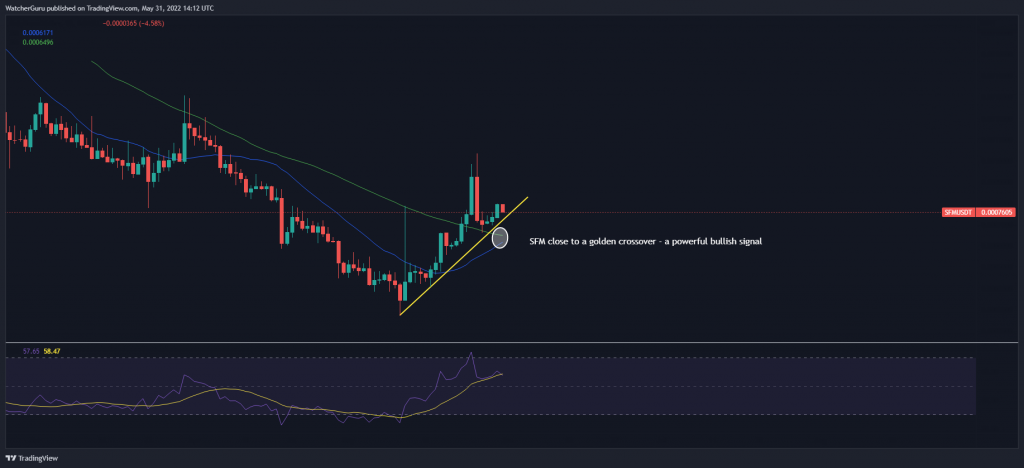
Firstly, the candles were placed above a supporting trendline, which meant that SFM’s uptrend potential remained intact despite the recent slowdown. Secondly, the 21-period Moving Average was about to shift past the 55-day Moving Average. The development typically referred to as a ‘golden crossover’, is a powerful bullish market signal which indicates the start of a long-term uptrend.
Finally, the daily Relative Strength Index had stabilized from overbought levels and maintained ground above 50-55. Generally speaking, an RSI reading above 50 indicates a bullish market and the same helps in attracting more buy orders.
How to trade SafeMoon V2
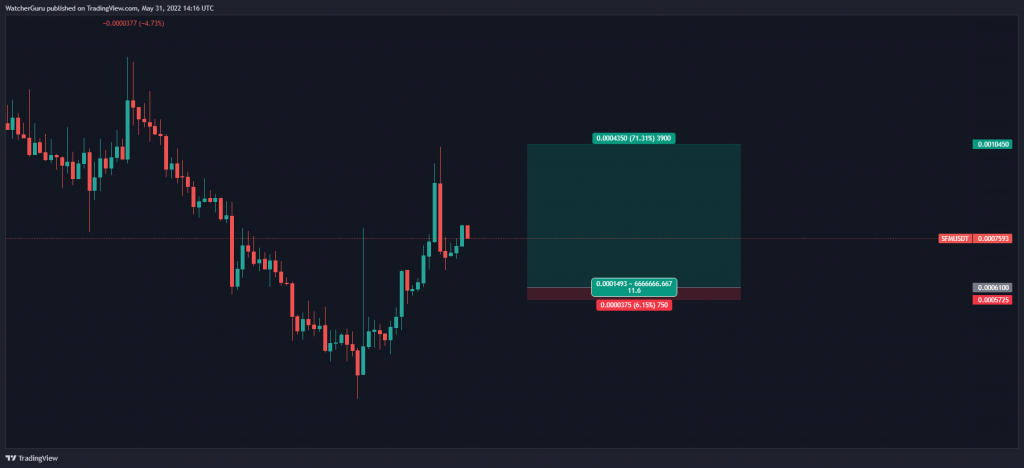
With SFM awaiting a key crossover, traders can get into early positions and capitalize on the projected hike. Buy orders can be set up at $0.0006100 and traders can cash out at $0.0010450. A stop-loss can be kept at $0.0005725. The hypothetical trade setup carried an 11.6x risk/reward ratio.