


A new lower low at $43.4 prompted a relief rally for LUNA soon after Wonderland’s exit fiasco soured market sentiment. However, the rally was approaching a staunch resistance area and an upwards breakout would not be easy.
At the time of writing, LUNA traded at $52.4, up by 16% over the last 24 hours.
LUNA 4-hour Chart
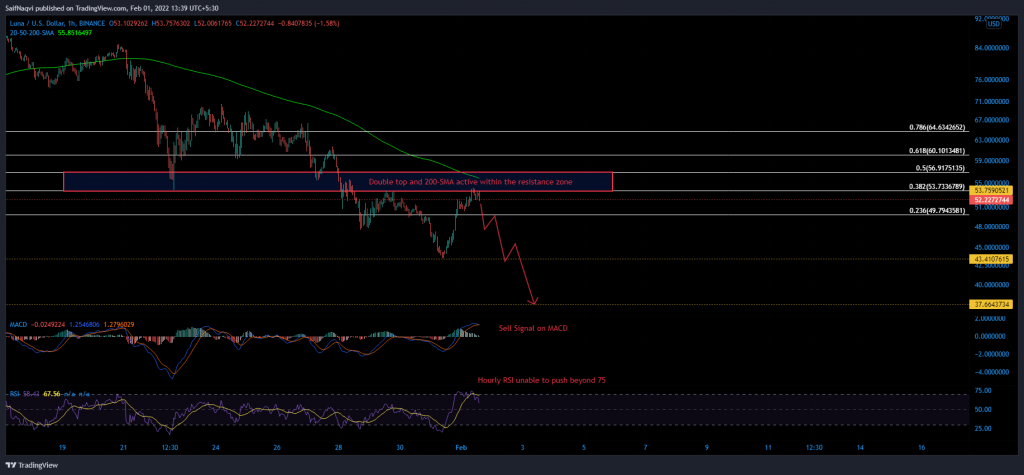
LUNA’s relief rally picked up steam after the price touched a tested the daily 200-SMA (not shown) around $43.4. However, the resulting run-up faced some crucial tests over the coming hours. For instance, a double top at the 38.2% Fibonacci level (calculated via a decline from $70.5 to $43.4), the hourly 200-SMA (green), and the 50% Fibonacci level were tightly spaced between $53-$57. The combination of these barriers outlined a rather sturdy resistance zone which could also invite short-term traders to cash in their gains.
Hence, if LUNA fails to close above $57, the next correction would be rather damaging. Since LUNA’s larger trajectory was dictated by a downtrend, the next lower low could be formed around $37.6. The potential downswing would highlight losses between 30%-34%.
Indicators
Both of LUNA’s hourly metrics pointed to imminent dangers ahead. The RSI has been unable to extend above overbought territory – a sign that upwards pressure was cooling down. This resulted in a potential sell signal on the MACD as the Signal line (orange) caught up to the fast-moving line (blue).
Conclusion
The presence of a tricky resistance area combined with red flags on the hourly metrics suggested that LUNA’s rally was coming to a close. Those who rode the bull wave from $43 can set take-profits between $57-$54. The resulting correction should be shorted until LUNA touches $37.6-support.