


A symmetrical triangle spotted on LUNA’s chart presented a compelling trade opportunity on the lesser time frame. Since the hourly indicators offered little insight into LUNA’s trend, the article focuses on a few important levels with respect to a breakout.
Terra (LUNA) hourly time frame
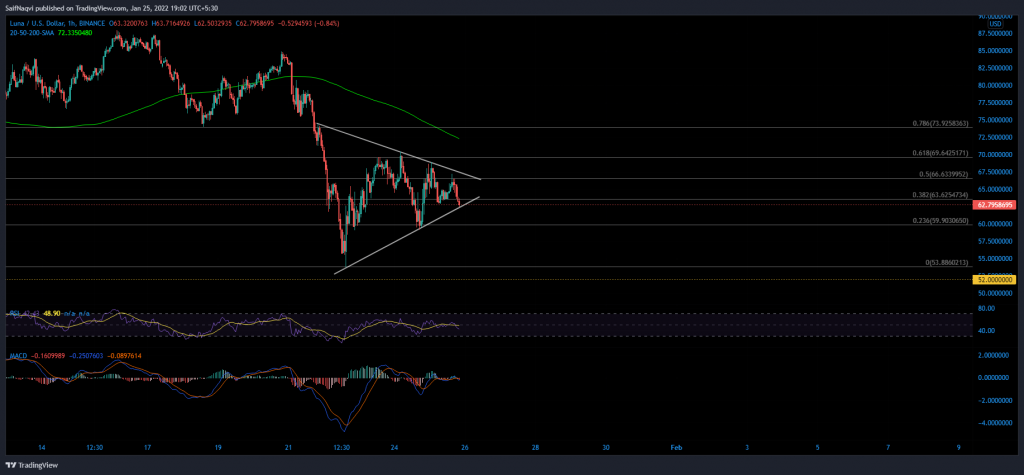
Two sloping trendlines plotted along a chain of lower highs and higher lows gave rise to a symmetrical triangle setup on the hourly time frame. Furthermore, the Fibonacci Retracement tool was plotted on a decline from $79.4 to $53.8 to identify key areas for a breakout.
READ ALSO: LUNA Price Prediction: Why investors should brace for a drop
To set up an upwards breakout, LUNA would have to close above the 50% Fibonacci level on strong volumes. However, buyers would face an early test around the 200-SMA (green), which floated close to the 78.6% Fibonacci level at $73.9. The same could keep restricting LUNA’s gain to just 8%.
On the other hand, a close below 21 January’s swing low of $61.7 would allow sellers to rip through the setup. If no early pushbacks are seen at the 23.6% Fibonacci level, LUNA would bear witness to a sell-off between 15%-18%. The next resting ground would be found close to $52 support.
Indicators
LUNA’s hourly metrics outlined the tit-for-tat between buyers and sellers. The hourly RSI held around 50 while the MACD and Awesome Oscillator remained bullish-neutral. Such findings are common within a symmetrical triangle as prices generally consolidate before a breakout. This lateral movement creates erratic patterns on the indicators unless a major divergence comes to light.
READ ALSO: Terra stablecoin, UST first to hit $10 billion market cap
Conclusion
LUNA’s symmetrical triangle was open to a breakout in either direction. Hence, market participants should wait for LUNA to close above or below certain areas on the chart before setting up their trades.