


MATIC’s price has traded along a supporting trendline since July 2021 and looks to retest the region once again. Bearish readings on the RSI and MACD primed MATIC for a near-term pullback. Once the pullback is complete, an ideal buy entry can be made at the 23.6% Fibonacci level. At the time of writing, MATIC traded at $2.40, down by 3% over the last 24 hours.
MATIC 4-hour time frame
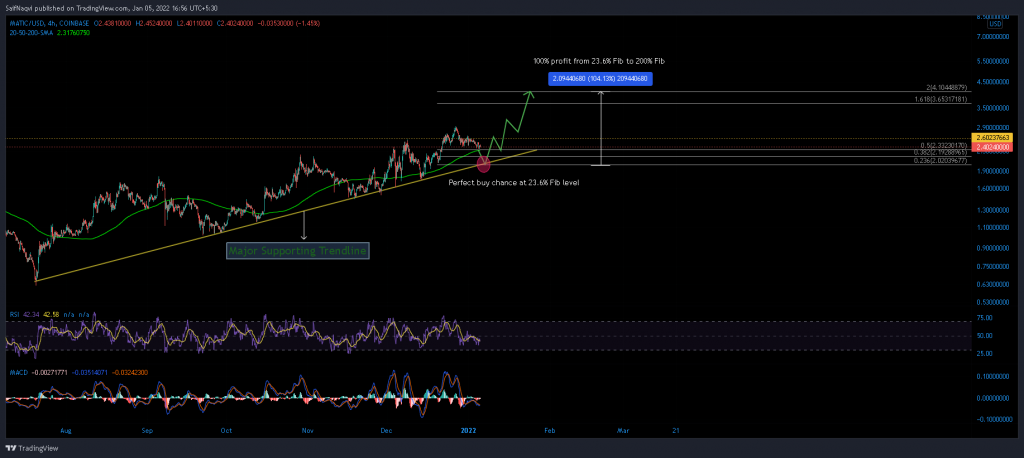
MATIC looks to build on its stellar 2021 performance in 2022 with a solid uptrend that showed no signs of halting anytime soon. A bottom sloping trendline charted MATIC’s ascent since July 2021, providing support on multiple occasions.
Based on current readings, MATIC was expected to test this trendline once again. The price was amidst a minor retracement after forming a new ATH around $2.92 in late December. Bearish indicators suggested that the alt was vulnerable to an additional 14% decline once its price weakens below the 200-SMA (green).
However, the pullback would give rise to an ideal buy entry at the 23.6% Fibonacci level at $2. The region was significant as it coincided with the bottom trendline and the daily 50-SMA (not shown). Once new longs are initiated, expect MATIC to make way towards the 161.8% and 200% Fibonacci levels.
Indicators
The 4-hour RSI has made a series of lower highs since 23 December and the trend has not yet been broken. This suggested that near-term control still belonged to the sellers.
The MACD traded below its half-line and short-selling was also a threat till a recovery was made above the half-line.
Conclusion
MATIC’s was expected to extend losses all the way to $2 over the following week. Buy entries can be made once the price tags its bottom sloping trendline close to the 23.6% Fibonacci level. Investors can rake in a 100% profit from their investments once MATIC tags the 200% Fibonacci Level above $4.