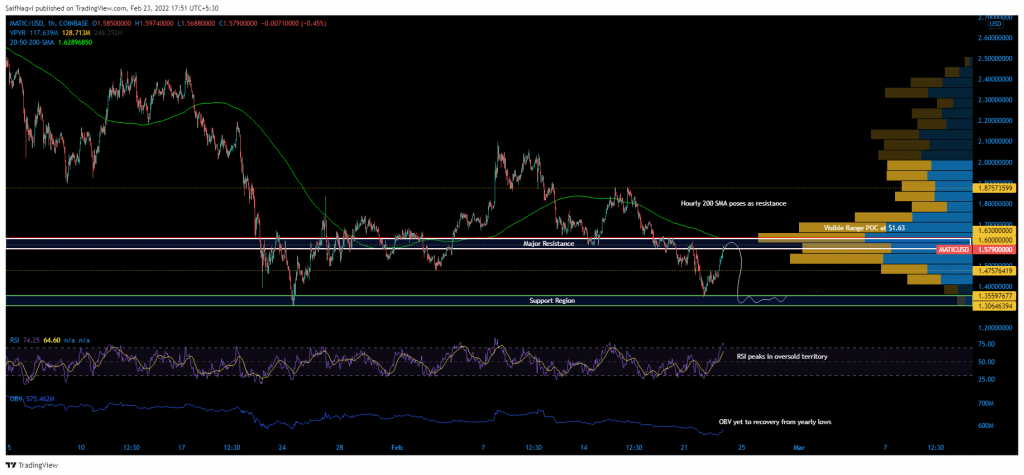
MATIC’s price was responsive to a general altcoin recovery, led by Bitcoin’s comeback above $38K. The mid-cap token recorded a 10% jump over the last 24 hours. However, the price was within a relatively high liquid zone and an oversold RSI could trigger selling behavior before MATIC closes above $1.60.
MATIC Hourly Time Frame


A MATIC recovery was in progress after the price slipped to a 1-month low at $1.355 on 22 February. A rebound from the daily support zone set MATIC above its 20-SMA (red), with short-term momentum shifting in favor of the buying side.
However, MATIC’s price was traversing through an important zone – one which could make or break its future direction. The Visible Range Profile noted a significant chunk of trades between $1.50-$1.76. Furthermore, the highest trades were placed around $1.60, also called the Point Of Control. Areas that contain a high number of trades are considered more liquid than other levels. Hence, the price tends to travel at a slower rate within such zones as there is pressure from both buyers and sellers. A rally is often considered strong if the price manages to close above such areas with ease. On the other hand, a rejection is taken as a sign of weakness and can also lead to bearish reversals.
For MATIC, the critical area of control stood at $1.60. The presence of the hourly 200-SMA (green) made a breakout even more important. On the downside, a 23% slash in trading volumes meant that MATIC’s ascent was not backed by strong buy volumes. The current reading was not encouraging especially when there is a key breakout a stake. An oversold RSI further complicated the chances of a bullish outcome, as the same usually signals profit-taking.
Conclusion
Several factors showed that MATIC did not have the necessary momentum to carry above $1.60. If the price fails to find support above $1.47 during the next downcycle, the market would be vulnerable to an additional 8%-11% sell-off. The projected dip would drag MATIC back to a demand zone of $1.35-$1.30.


