Aave’s monumental hike since its V3 update was a sight to behold. The price was currently trading at over a 2-month high after spiking by 120% since 15 March. Furthermore, those who have missed out on the bull run can still get in on the action. AAVE’s strong network activity and TVL show no signs of cooling, suggesting that the positive price action could continue over the coming days.
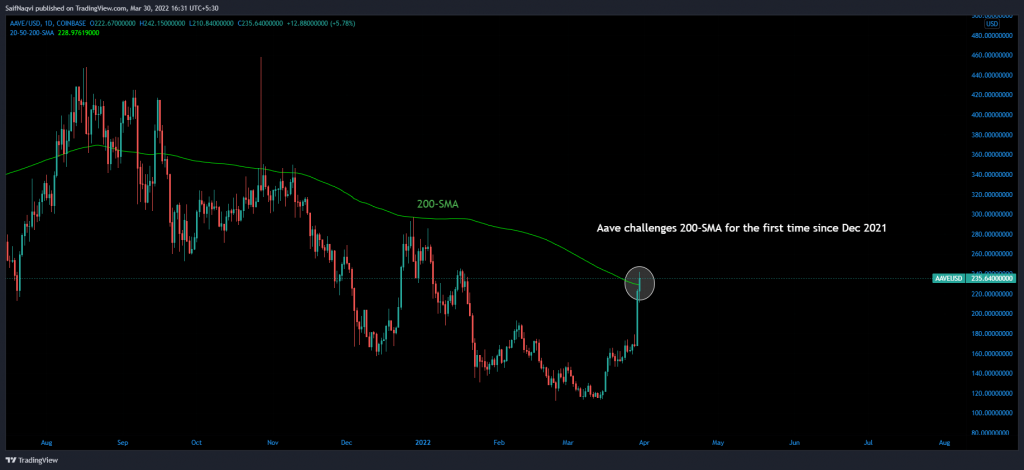
Aave Daily Chart


The latest hikes have put Aave at the helm of its 200-SMA (green) for the first time since December 2021. In technical terms, a breakout above the 200-SMA creates opens a route to more positive price action.


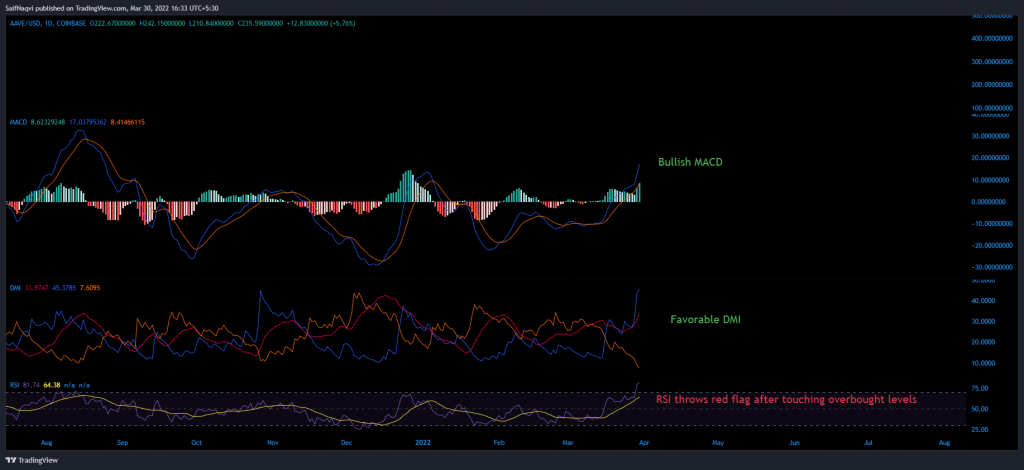
Furthermore, no warning signs developed on the MACD and DMI, which continued to heavily favor the bullish side. Both indicators gauge market trends and momentum.
However, not all indicators were equally bullish. On the flip side, the RSI was reflective of buying euphoria after peaking at overbought levels. Normally, traders tend to cash out at an overbought RSI, but certain macro factors suggested that the same could be discounted this time around.
Network Continues To Grow

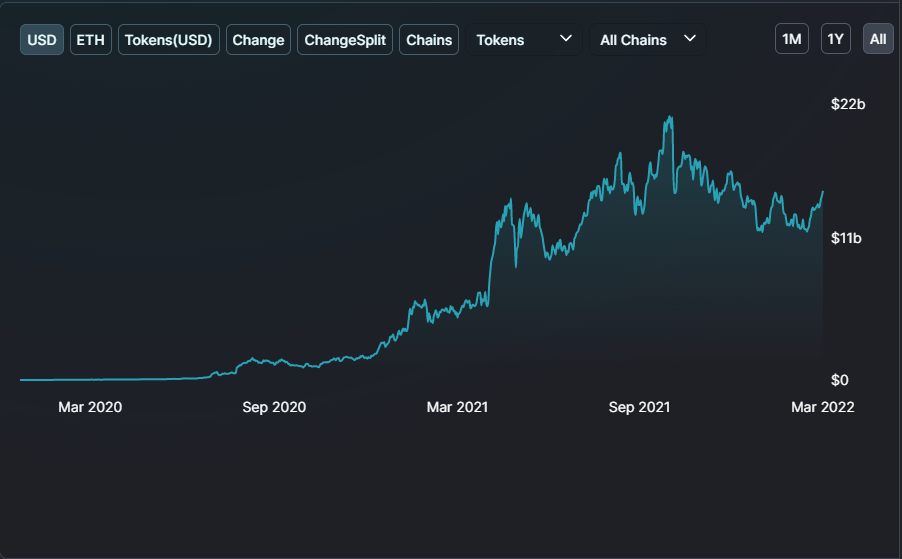
For one, Aave’s network was amidst a strong revival period. The project’s Total Value Locked (TVL) was up by 27% since 16 March, highlighting an increase in users who were engaging in Aave’s lending protocol.


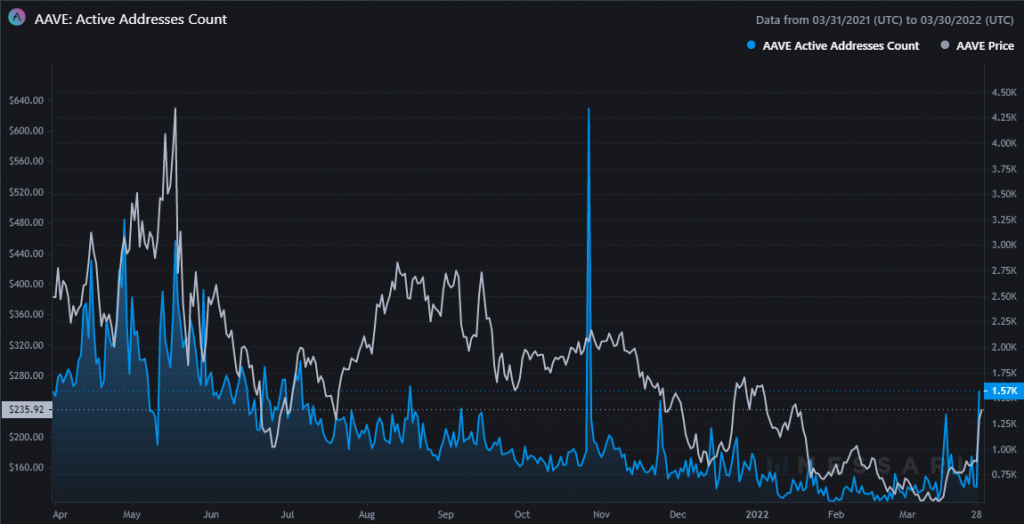
Furthermore, the daily active addresses count was up by a massive 151% over the past week, showing a soaring interest in Aave’s network.
With the above-mentioned factors buttressing Aave’s price as it challenges the 200-SMA (green), Aave’s glory days could be set to continue. With that in mind, traders can set up buy orders at $250 and cash out around the $298-mark. A stop-loss can be maintained at $200.


