


Of late, Bitcoin has been quite receptive to the deteriorating macro conditions. Last week, for instance, US’s inflation data release instilled shock. In merely an hour, Bitcoin tumbled from a daily high of $2018 to under $18900.
Leaving aside the US, other major economies have also started releasing their numbers or are set to reveal the same in the coming days. New Zealand’s inflation, for instance, hit 7.3% – the highest rate since 1990. Per reports, the rise was driven by increasing rents and construction costs.
This week, the Euro Zone, the UK, Canada, and Japan are expected to publish their CPI data. As expected, there are hardly any positives to look forward to.
Bitcoin’s slump phase to extend?
The king coin’s macro bullish leg is fractured. Lately, however, it has been healing faster than usual, and Bitcoin has noted a 15% incline in just the past six days. So, despite the recent green streak, does the unfavorable macro environment potentially push Bitcoin lower?
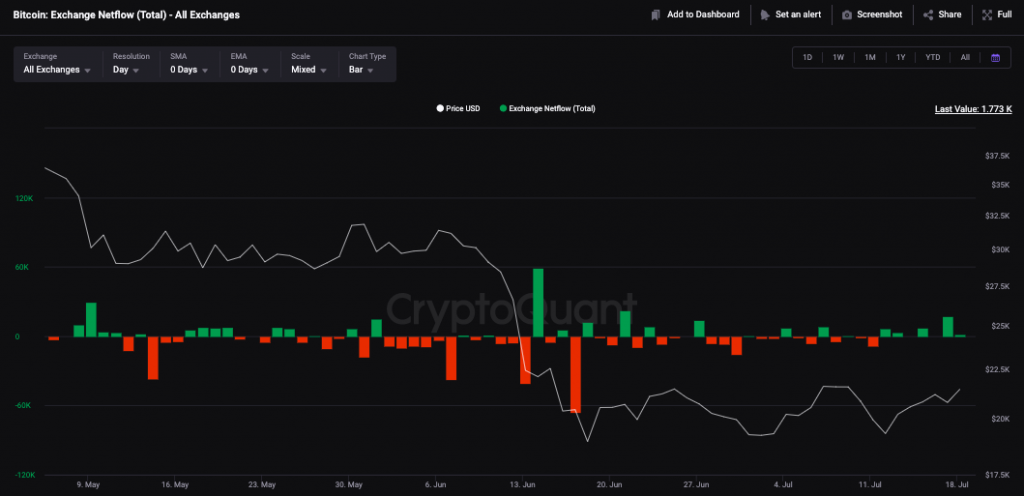
Well, likely yes. The bearish sentiment is still prevalent in the market. The chart below illustrates that the net exchange flows have been registering green bars since last week. The same suggests that market participants have been more inclined towards selling. Such behavior usually hinders the price-rise path and isn’t a healthy sign during recovery phases.
Would the scars be deep?
Even though it looks like Bitcoin’s price is primed to continue correcting at this stage, indicators suggest that it would be able to HODL its horses after briefly falling.
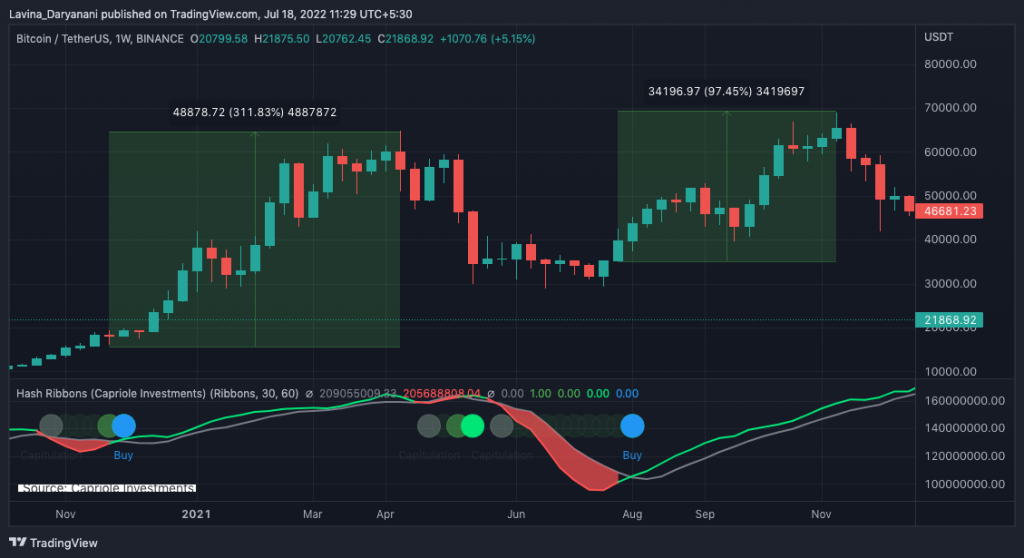
The hash ribbon, for starters, hasn’t yet pointed out a bottom for Bitcoin. Simply put, this indicator usually pans out in three phases. The first phase marks the commencement of capitulation, and the indicator’s circle usually flashes shades between gray and light green. The next phase represents the near-conclusion of capitulation. On the charts, a bright green dot appears. Bitcoin’s price, alongside, starts recovering.
The third phase begins when the blue dot or the buy signal is flashed. More often than not, this phase has marked the initial leg of Bitcoin’s price rally. In most cases, green dots have paved the way for blue dots. Retrospectively, Bitcoin has substantially rallied post blue flashes.
As seen from the chart attached below, this indicator registered a dark green dot towards the beginning of this month. At that time, it was speculated that the blue dot would follow. Notably, Bitcoin was oscillating around $18k, suggesting that the said level could be the potential bottom for the asset.
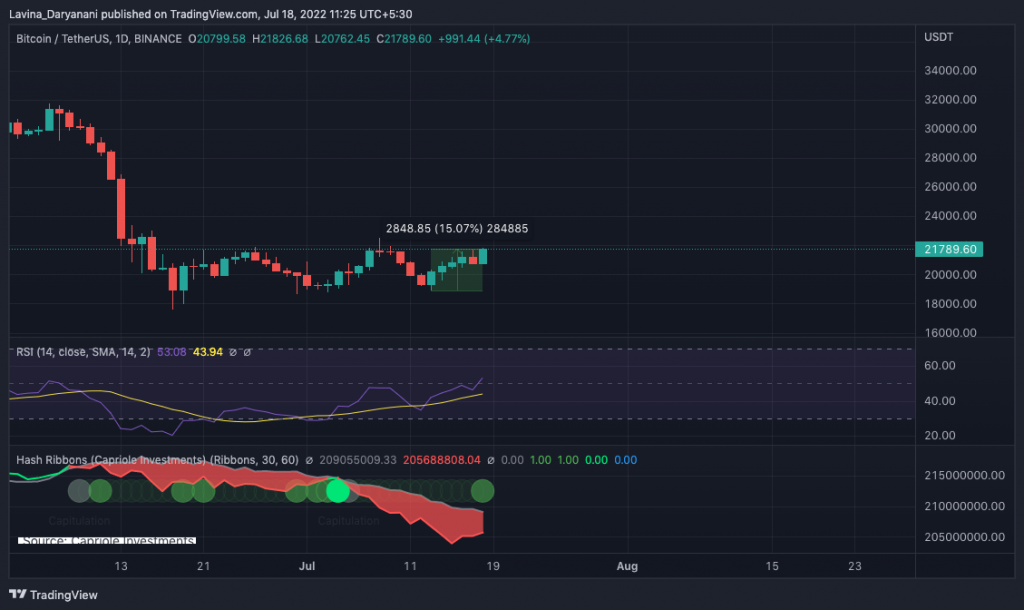
Things did not pan out as expected due to the micro trend flip. Now, however, the shade of green is darkening, implying that the scars wouldn’t be that deep this time.
The HODLer behavior supports the said narrative. A few hours back, Glassnode brought to light that around 80% of the total US dollar-denominated funds invested in Bitcoin have not been touched for at least three months.
This signals that the “majority of BTC coin supply is dormant,” and long-term HODLers do not want to part ways with their BTC at lower prices.
So, even though the sell-bias is prevalent in the market, the HODLer conviction can potentially restrict Bitcoin from free-falling. And per the hash-ribbons signals, Bitcoin’s losses wouldn’t mount more than a few thousand dollars from its current $21.7-$21.8 level.