


SafeMoon V2’s price has shifted gear since the first week of March. The price fell under bearish shackles after a 30% climb between 24 February-3 March. However, the altcoin is targeting a return to form. Its candles were trading at a lucrative buy area and the near-term trajectory was optimistic. At the time of writing, SFM traded at $0.001073, down by 6% over the last 24 hours.
SafeMoon Trends On LunarCrush
The SafeMoon army is active as it can ever be during the project’s birthday month. Data from LunarCrush showed that SafeMoon grabbed the 4th spot on the top DeFi projects by social activity, outpacing prominent projects such as Fantom and Chainlink.
The data created a stir within the community. As per data aggregator nomics, SFM’s 24-hour trading volume across exchanges rose by 800% to $67.2 Million. High trading activity is generally an ominous sign of increasing volatility and strong price movement.
SafeMoon V2 4-hour Chart
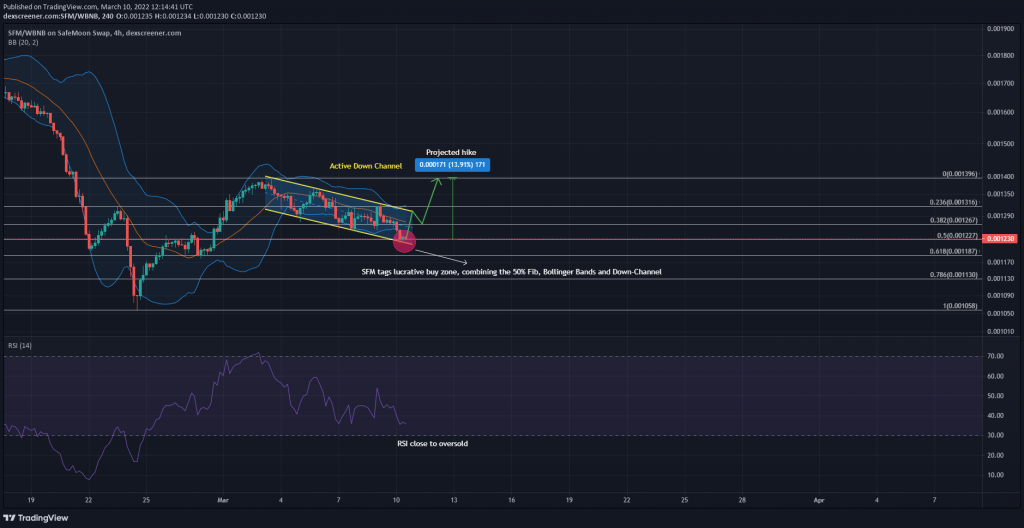
SafeMoon V2’s 4-hour chart was not reflective of high volumes just yet but the Bollinger Bands gave a deeper understanding of what’s to come. The indicator showed that SFM’s candles were trading at the bottom band. Whenever the price trades at the end of the bands, a strong reversal takes place or losses/gains occur at a faster rate.
Adding the boundaries of a down-channel and combining the same with the Fibonacci Retracement level showed that SafeMoon was up for grabs. The 50% Fibonacci level, the down channels bottom trendline, and the lower band of the BB formed solid support for SFM. If a large chunk of rising volumes were placed at SFM’s current level, the price would likely rebound to the upper trendline following an immediate 7% ascent. A potential upwards breakout could even lift the price by another 7%, bringing the total profit to 14%.
To sustained the favorable outlook, it was important to look at the 4-hour RSI as well. The index was 5 index points away from the oversold zone – a reading which is normally relied upon by bullish traders when bets are placed.
Price Strategy
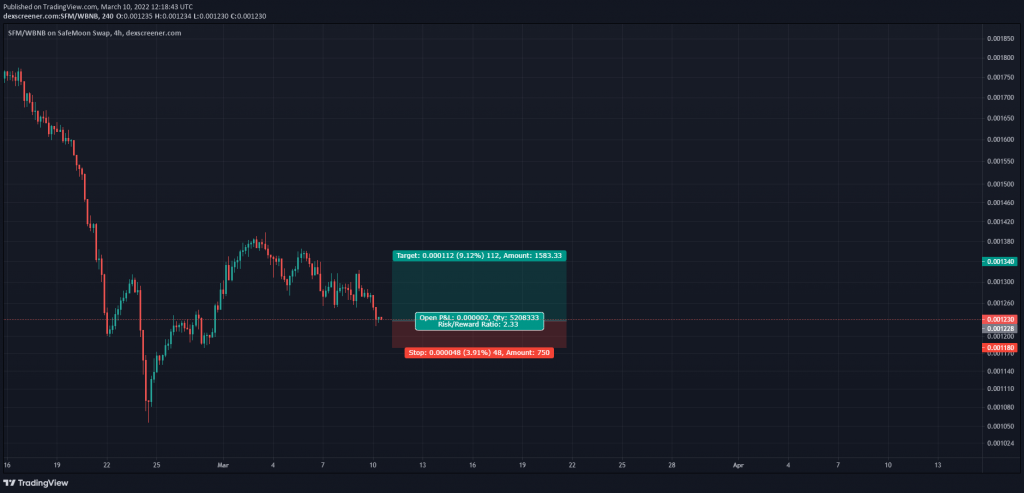
With a sharp move due for SafeMoon, there was reasonable evidence to suggest an upwards run. Those wishing to buy SFM can do so at $0.001228. Take-profit can be set at $0.001396 and stop-loss at $0.001180, just below the 61.8% Fibonacci level. The hypothetical trade setup carried a 2.33 risk/reward ratio.
A tight stop-loss has been maintained to mitigate risks in case the price breaks below the down-channel.