


SAITAMA’s down-channel has featured on the chart during the last three days of trade. Signs of weakness on the RSI and MACD suggest that SAITAMA would slip lower over the coming days and reset within its hourly demand zone. At the time of writing, SAITAMA traded at $0.00000001769, down by 5.4% over the last 24 hours.
Saitama Hourly Time Frame
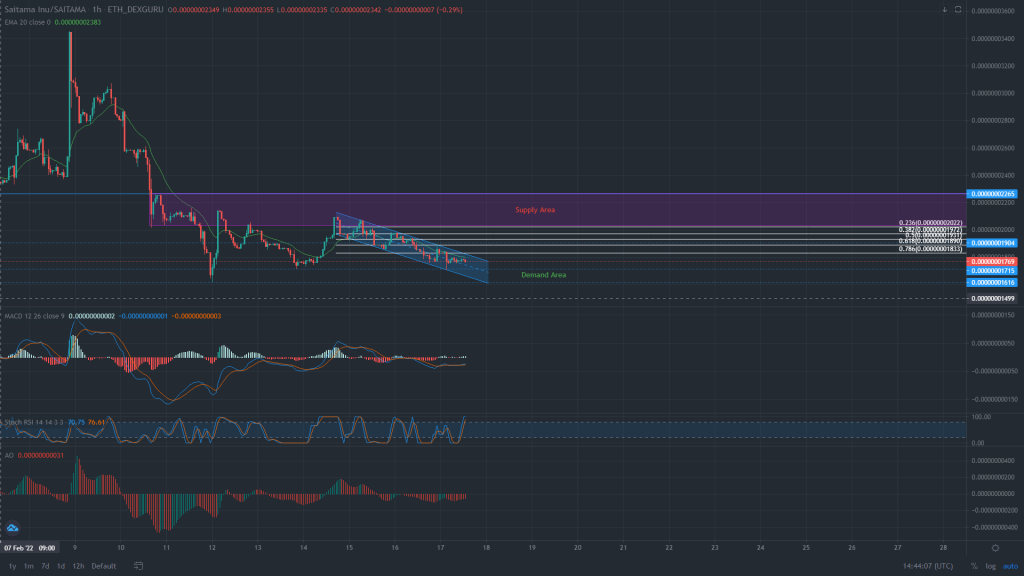
SAITAMA’s down-channel was set to continue until new lower low forms within the hourly demand zone between $0.00000001666-$0.00000001606. With the candles trading below their hourly 20-EMA (yellow), the chances of a bullish breakout from the channel were slim. Instead, bulls would have an easier task at hand once SAITAMA tags its demand zone.
Until then, the price was expected to be pressurized by an overbought stochastic RSI and a weak MACD. Potential for incoming losses ranged from 6%-9% unless an early pushback is observed at $0.00000001715. A channel breakdown would even bust the doors wide open to additional sell-offs. The next logical defense resided only at $0.00000001161.
Now, a favorable outcome should not be discounted, especially since two higher peaks on the Awesome Oscillator (AO) created a bullish twin peak setup. A new high formed near the 78.6% Fibonacci level could lead to an upwards breakout and call for a retest of a supply zone between $0.00000002265-$0.00000002202. However, keep in mind that the AO’s buy signal is often discounted during a risk-off broader market.
Conclusion
Saitama was expected to revisit its hourly demand zone as its down-channel extends lower on the chart. There was an outside chance of an early upwards breakout but only if SAITAMA can close above the 23.6% Fibonacci level on good buy volumes.