Bitcoin reached a new all-time high of $67,000 but it might have slowed down the bullish momentum of Shiba Inu. After surging by 830% in October, It is currently registering a 17% drop for November. However, over the next few days, the asset may reflect another breakout, hence the need for Shiba Inu Price Prediction. At press time, Shiba Inu had a market cap of $34 billion, ranked 11th in the charts.
Shiba Inu 4-hour time frame


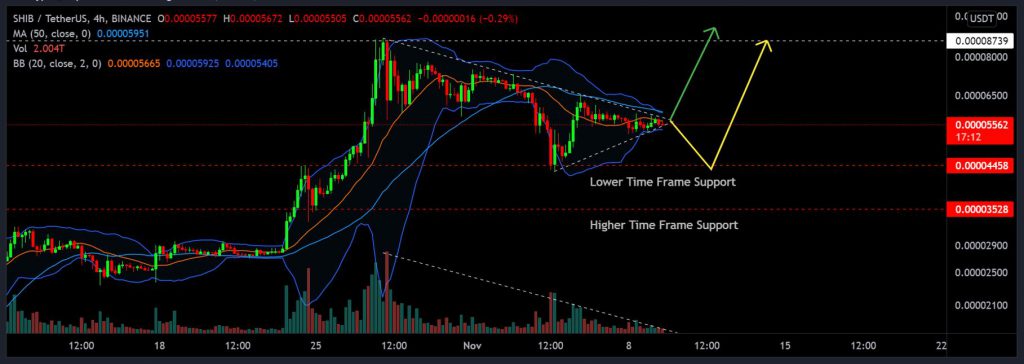
Shiba Inu reached $0.00008854 on 27th October but it has continued on a downward part after the peak. Over the past week itself, Shiba Inu dropped by 22%. At press time, SHIBA is oscillating between a symmetrical triangle. The possibility of a bullish and bearish breakout is currently a 50-50 split. At the moment, a couple of situation is foreseeable for the meme token.
A bearish breakout may take Shiba down to an LTF(Lower Time-Frame Support) of $0.00004458 before it re-traces and exhibits a bullish reversal. The 2nd scenario could be an immediate bullish move where the previous all-time high of $0.00008854 will be tested. The dropping trading volumes alongside the price is a good indicator that rising trading volumes would have a positive impact.
Bollinger Bands(blue converging lines) also suggested that the market is primed for a breakout after dropping down volatility over the past week.
Market Indicator


Relative Strength Index or RSI is currently neutral between buying and selling pressure. It means both the bulls and bears lack directional momentum. MACD lines suggested a minor bullish trend. However, it was extremely feeble and did not indicate a clear trend.
How should traders invest in Shiba
Unless Shiba Inu breaks under the High-Time Frame support of $0.00003528, the long-term trend is still bullish for Shiba Inu price prediction. For the short-term, it is critical to witness a breakout from the symmetrical triangle first. Then, an investment decision should be made in terms of short-term profitability.


