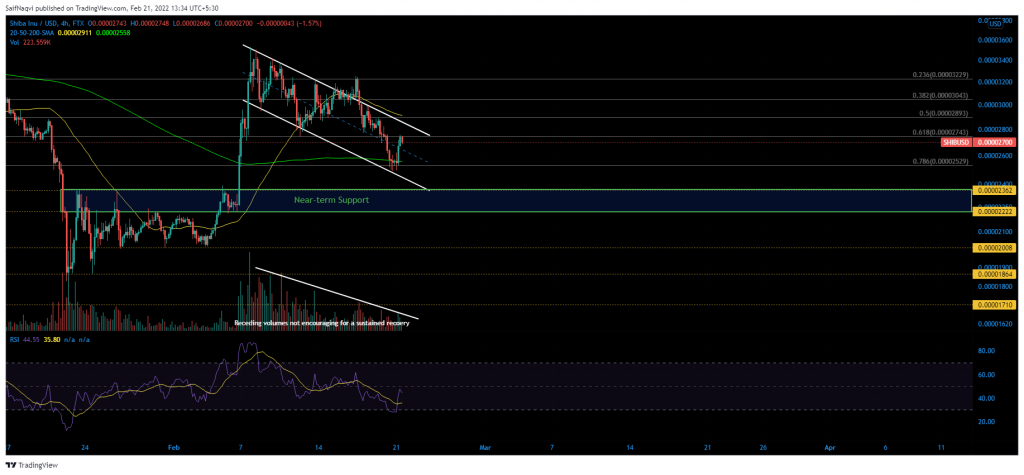
The Shiba Inu chart noted a slight recovery attempt after a 20% decline was observed between 17-20 February. However, the upside was expected to be limited at $0.00002893, with the RSI and 4-hour 50-SMA (yellow) still running bearish. At the time of writing, SHIB traded at $0.00002678, up by 5% over the last 24 hours.
Shiba Inu Daily Time Frame


Since 7 February, Shiba Inu has mostly traded within the confines of a down-channel, with losses extending as low as 30% from the highest to the lowest point within the pattern. While the lesser time frame did note a marginal recovery over the last 24 hours, buyers had not fully embraced the recovery. As per CoinMarketCap, the meme token’s 24-hour trading volume saw an uptick of just 5% at press time. Furthermore, the 4-hour RSI, despite a northbound push, was yet to shift above 55. Until these conditions shift in favor of the bulls, Shiba Inu’s upside would likely be capped at the 61.8% Fibonacci level. The aforementioned area coincided with the 4-hour 50-SMA (yellow), bolstering its defenses.
While a support region between $0.00002362-$0.00002222 would be responsible for containing any near-term sell pressure investors can expect a deeper retracement if SHIB closes below this lower limit.
Shiba Inu Daily Time Frame


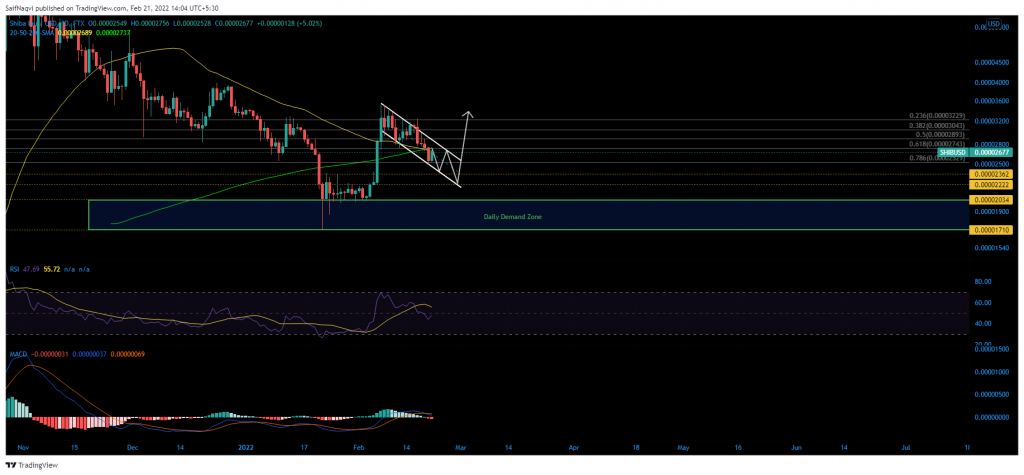
Although Shiba Inu’s recovery was captured in a lesser time frame, weakness remained clear on the daily chart. An unfavorable crossover was developing on the 200-SMA (green) and 50-SMA (yellow), while the MACD depicted a clear sell signal after the Signal line (orange) shifted above the Fast-moving line (blue). The RSI had also penetrated bearish ground below 50 albeit with a slight uptick.
Conclusion
Shiba Inu’s down-channel was expected to stretch lower on the charts until the near-term support is met. On the flip side, an immediate close above the 50% Fibonacci level would invalidate the bleak outlook. Should bulls get behind the resulting swing, SHIB would be open to another 12% surge back to 17 February’s swing high of $0.00003254.


